Create A Graph with Two/Multiple Y-axis using Python Matplotlib
Nov. 03, 2024 • Updated Nov. 03, 2024
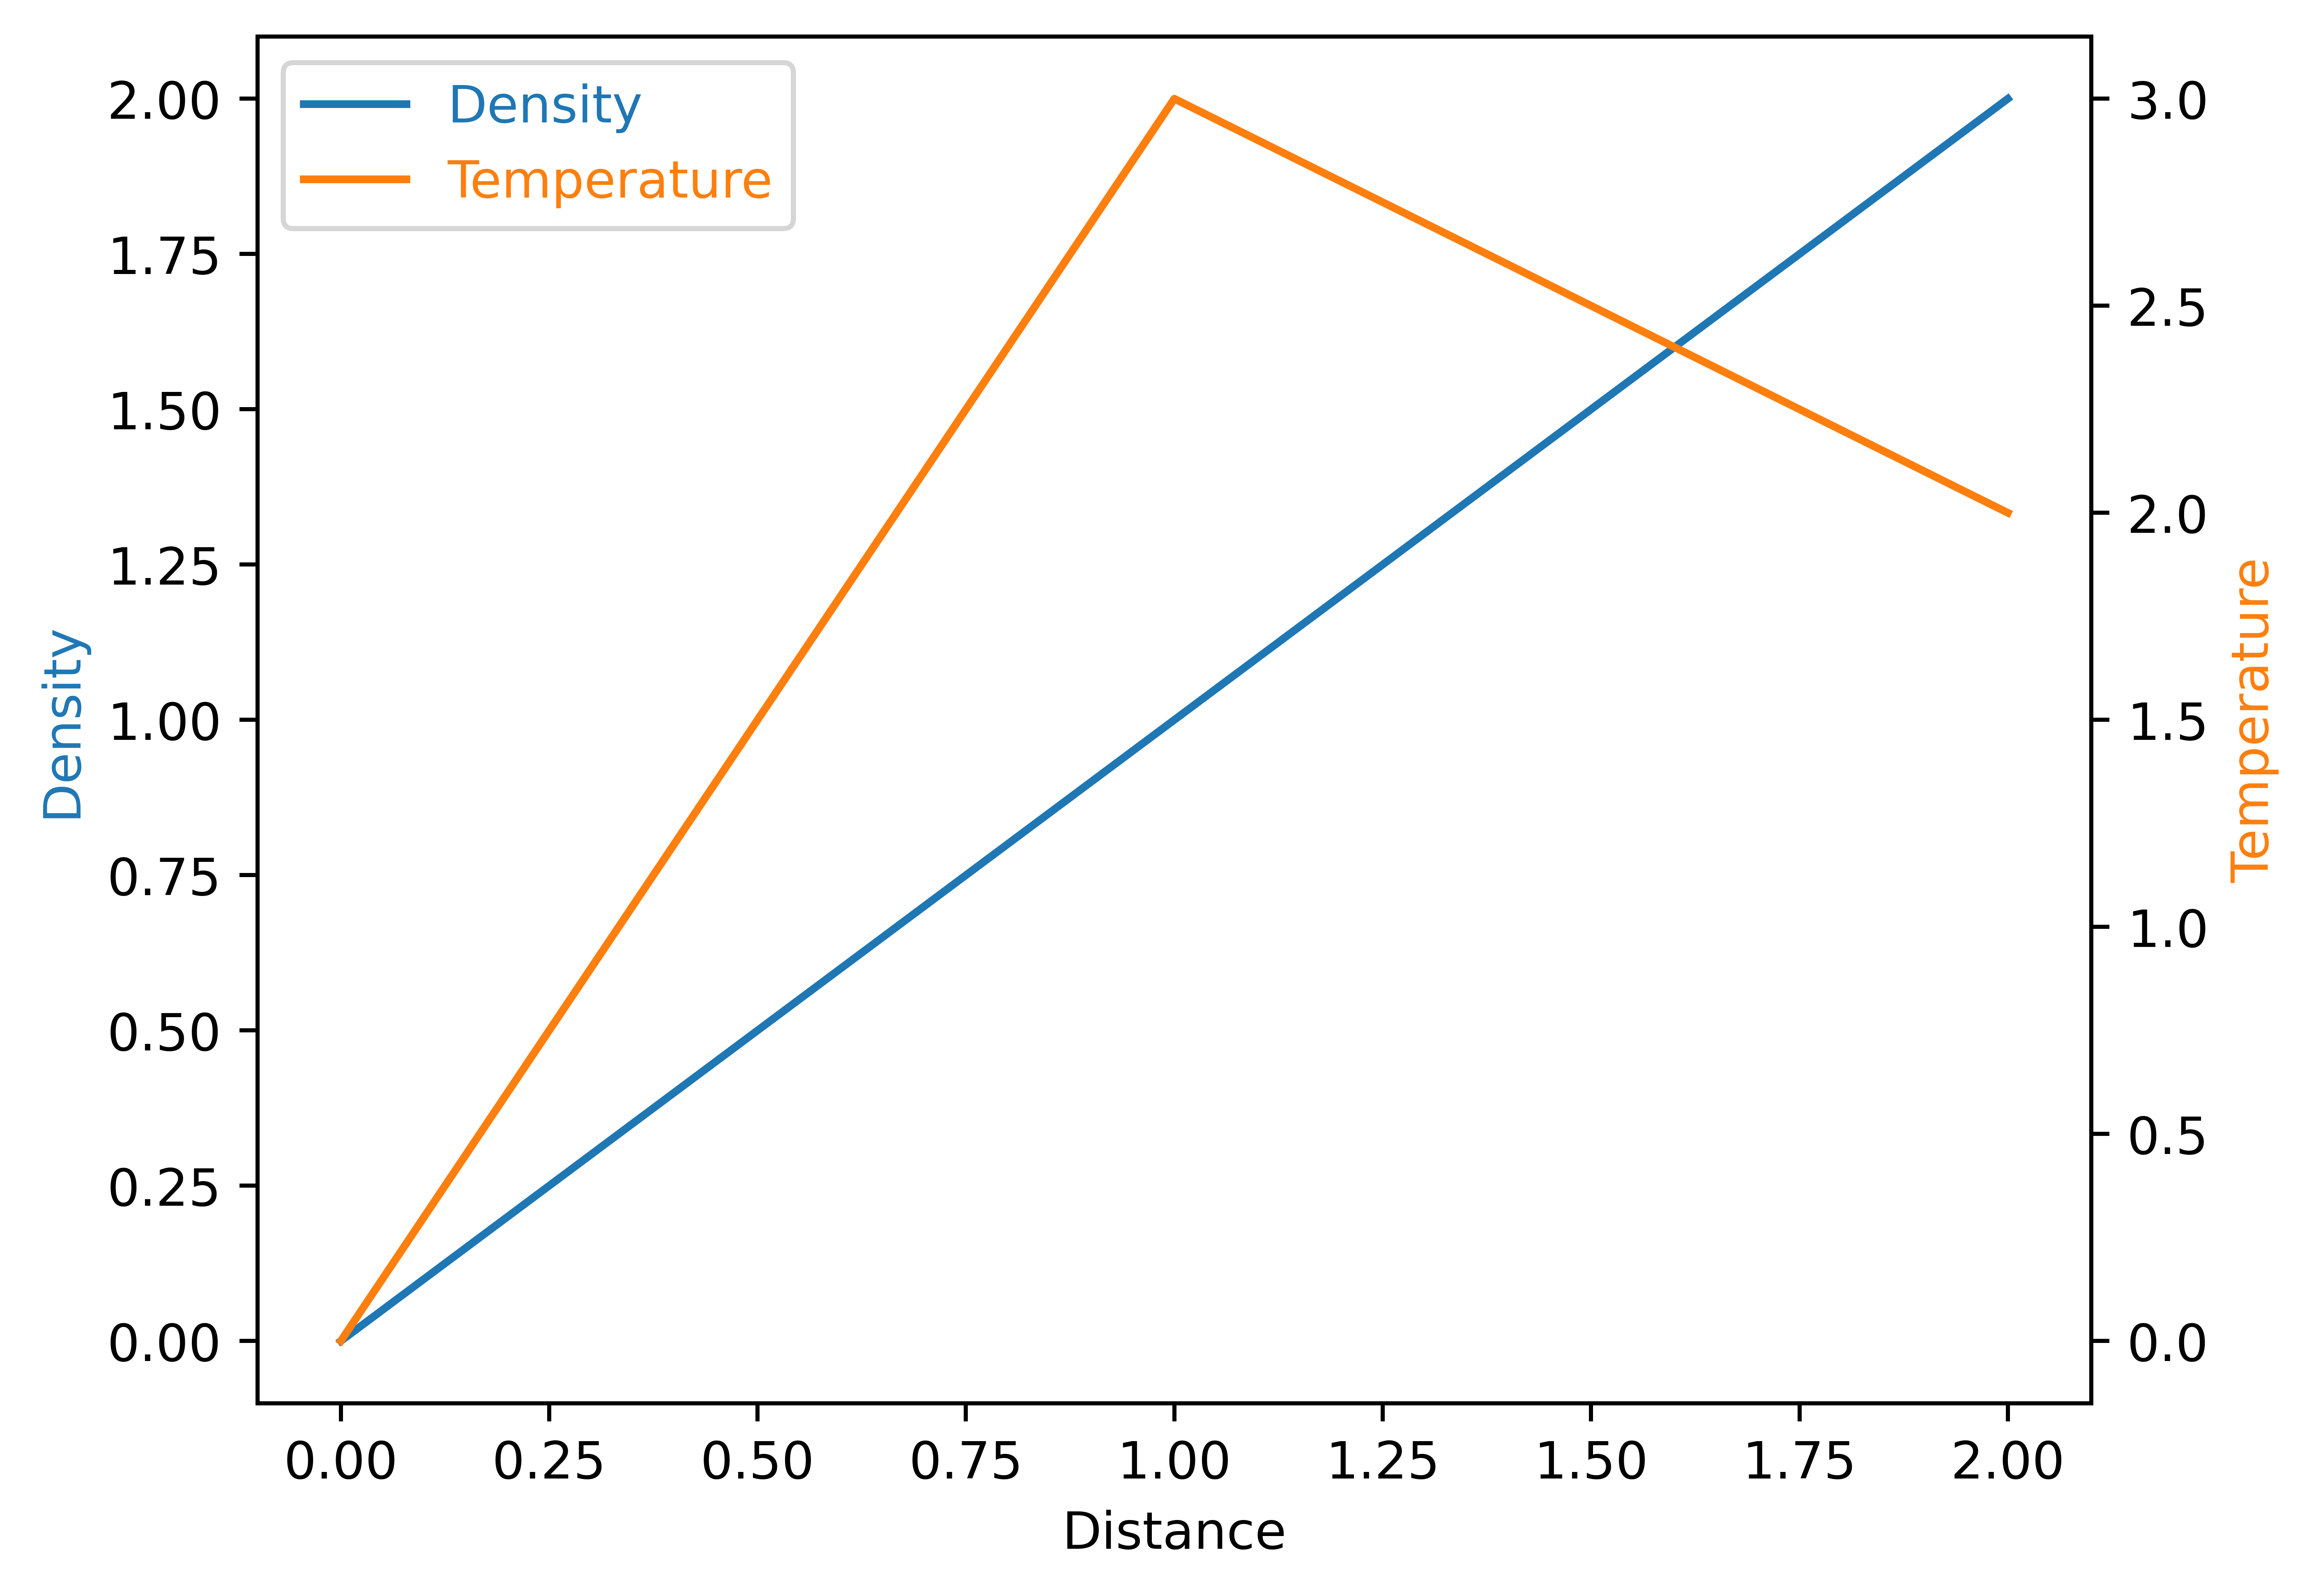
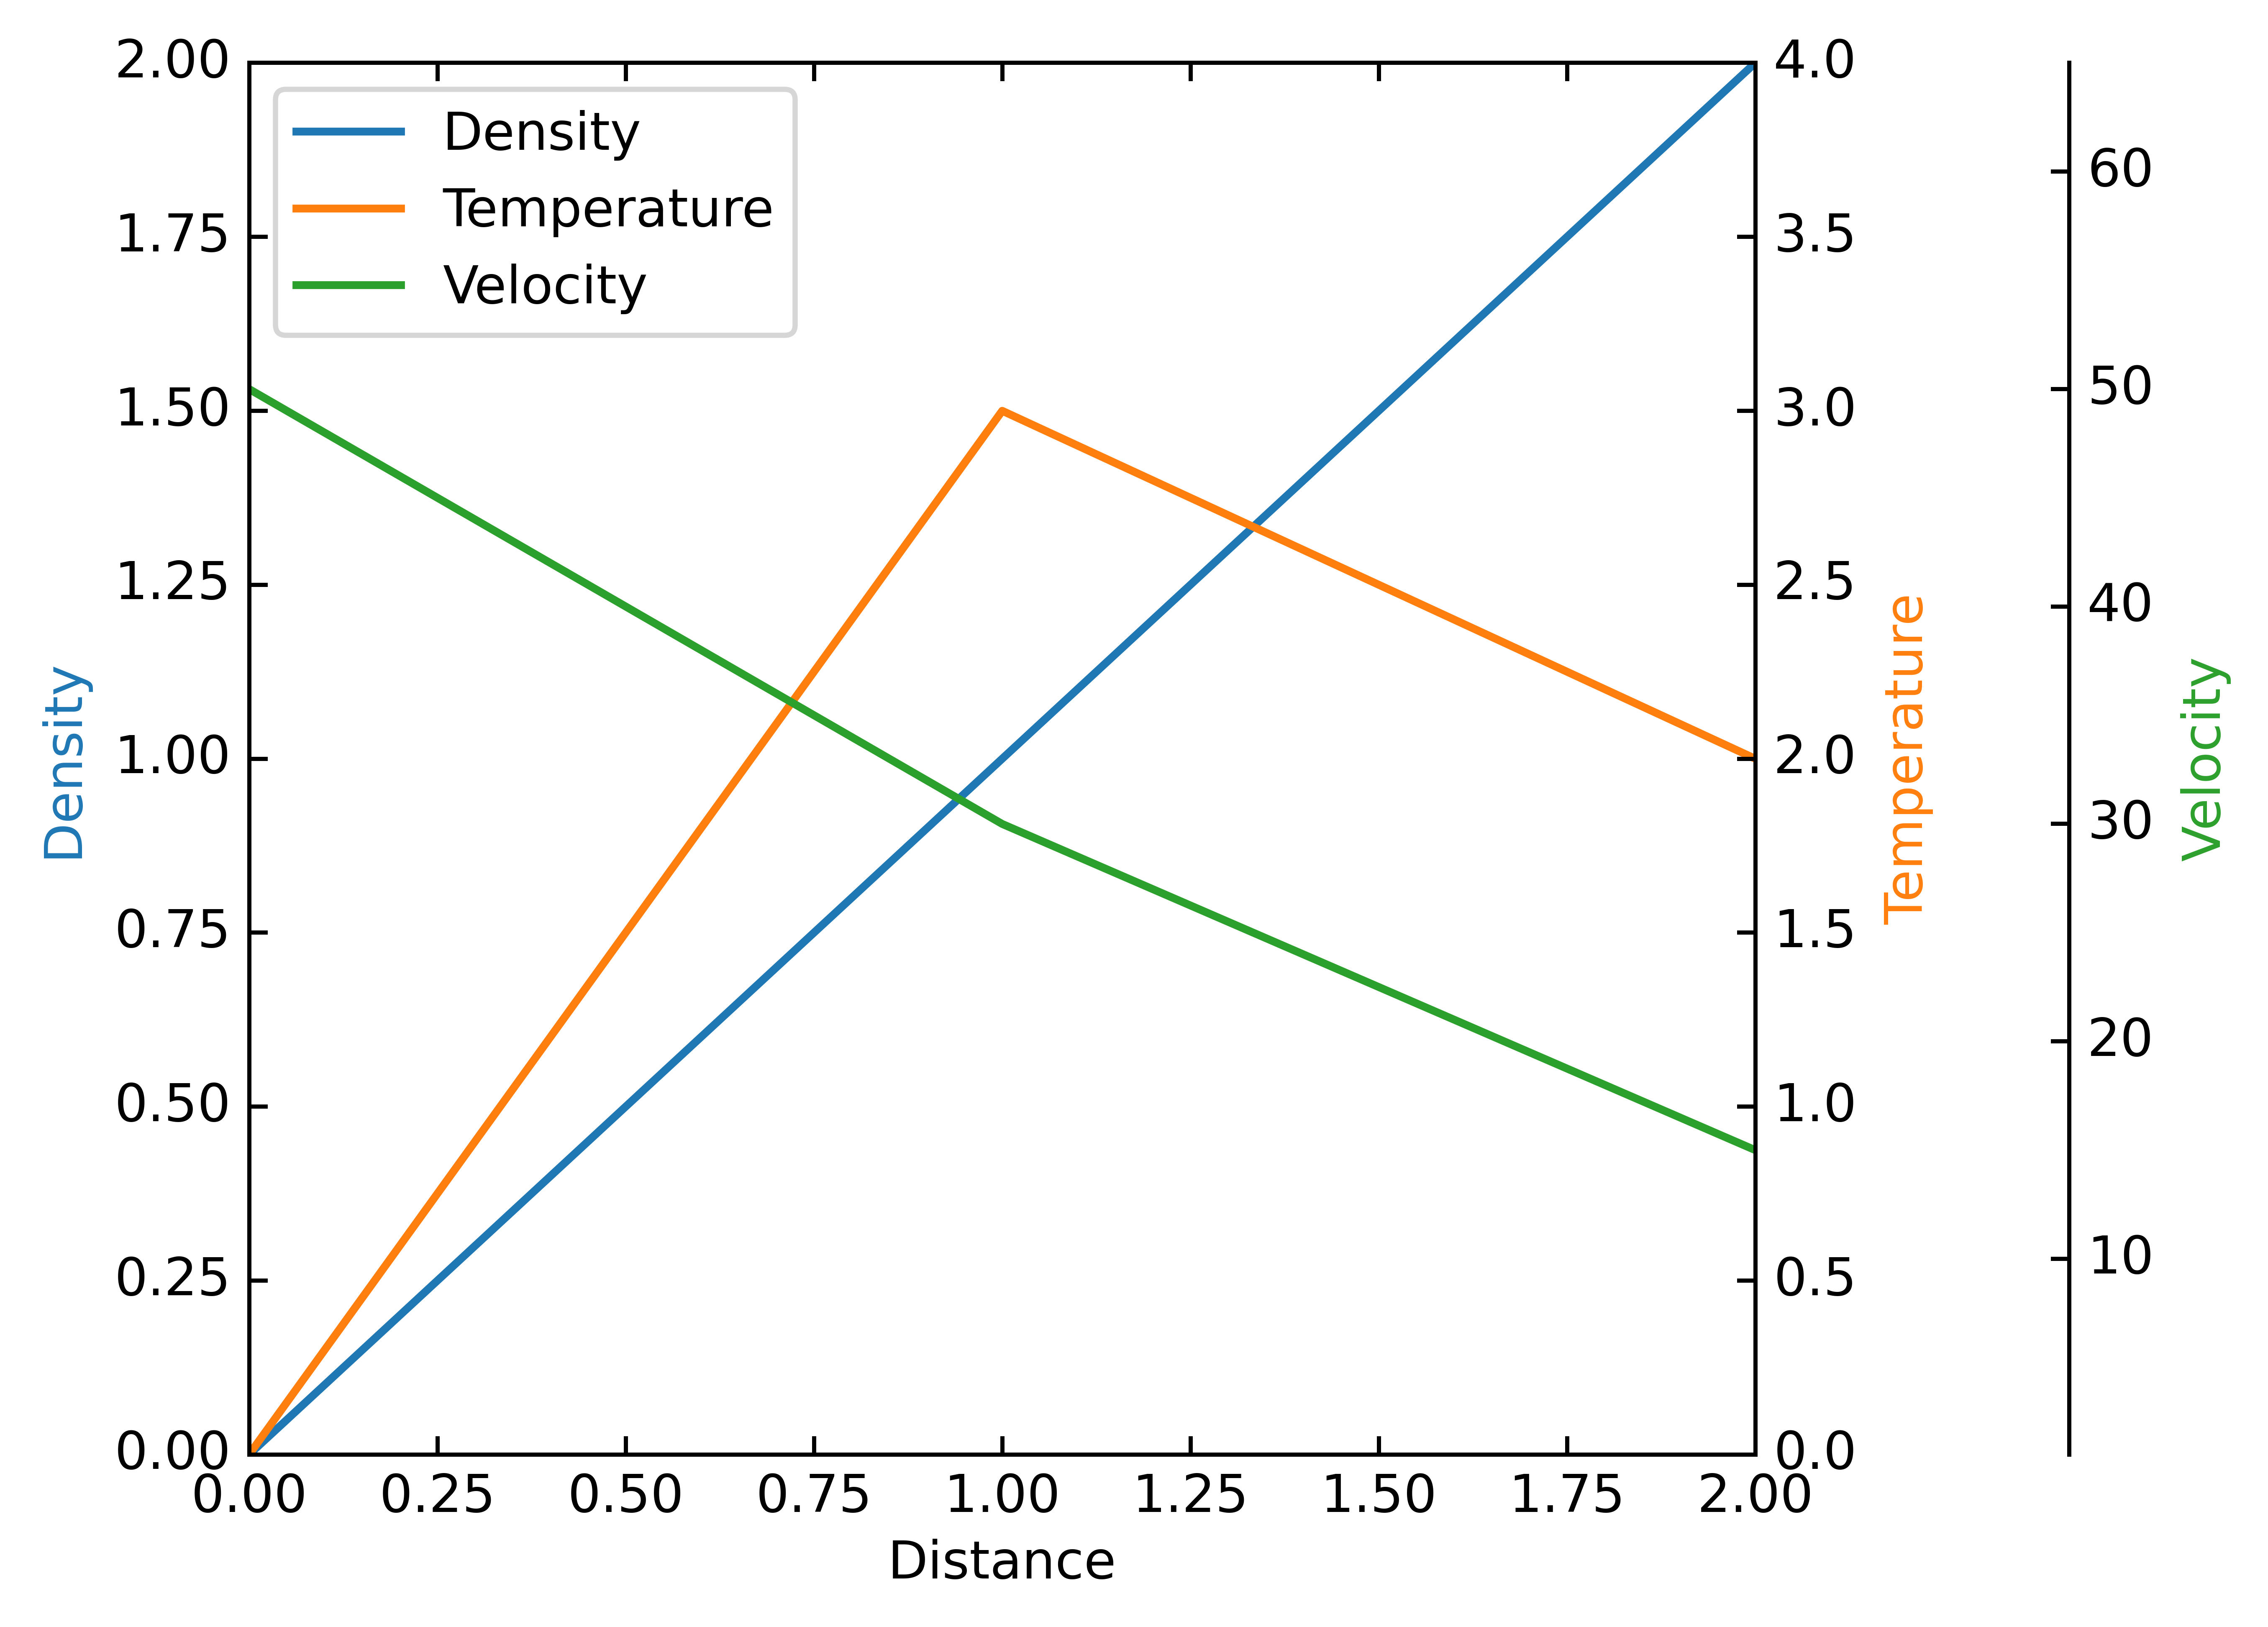
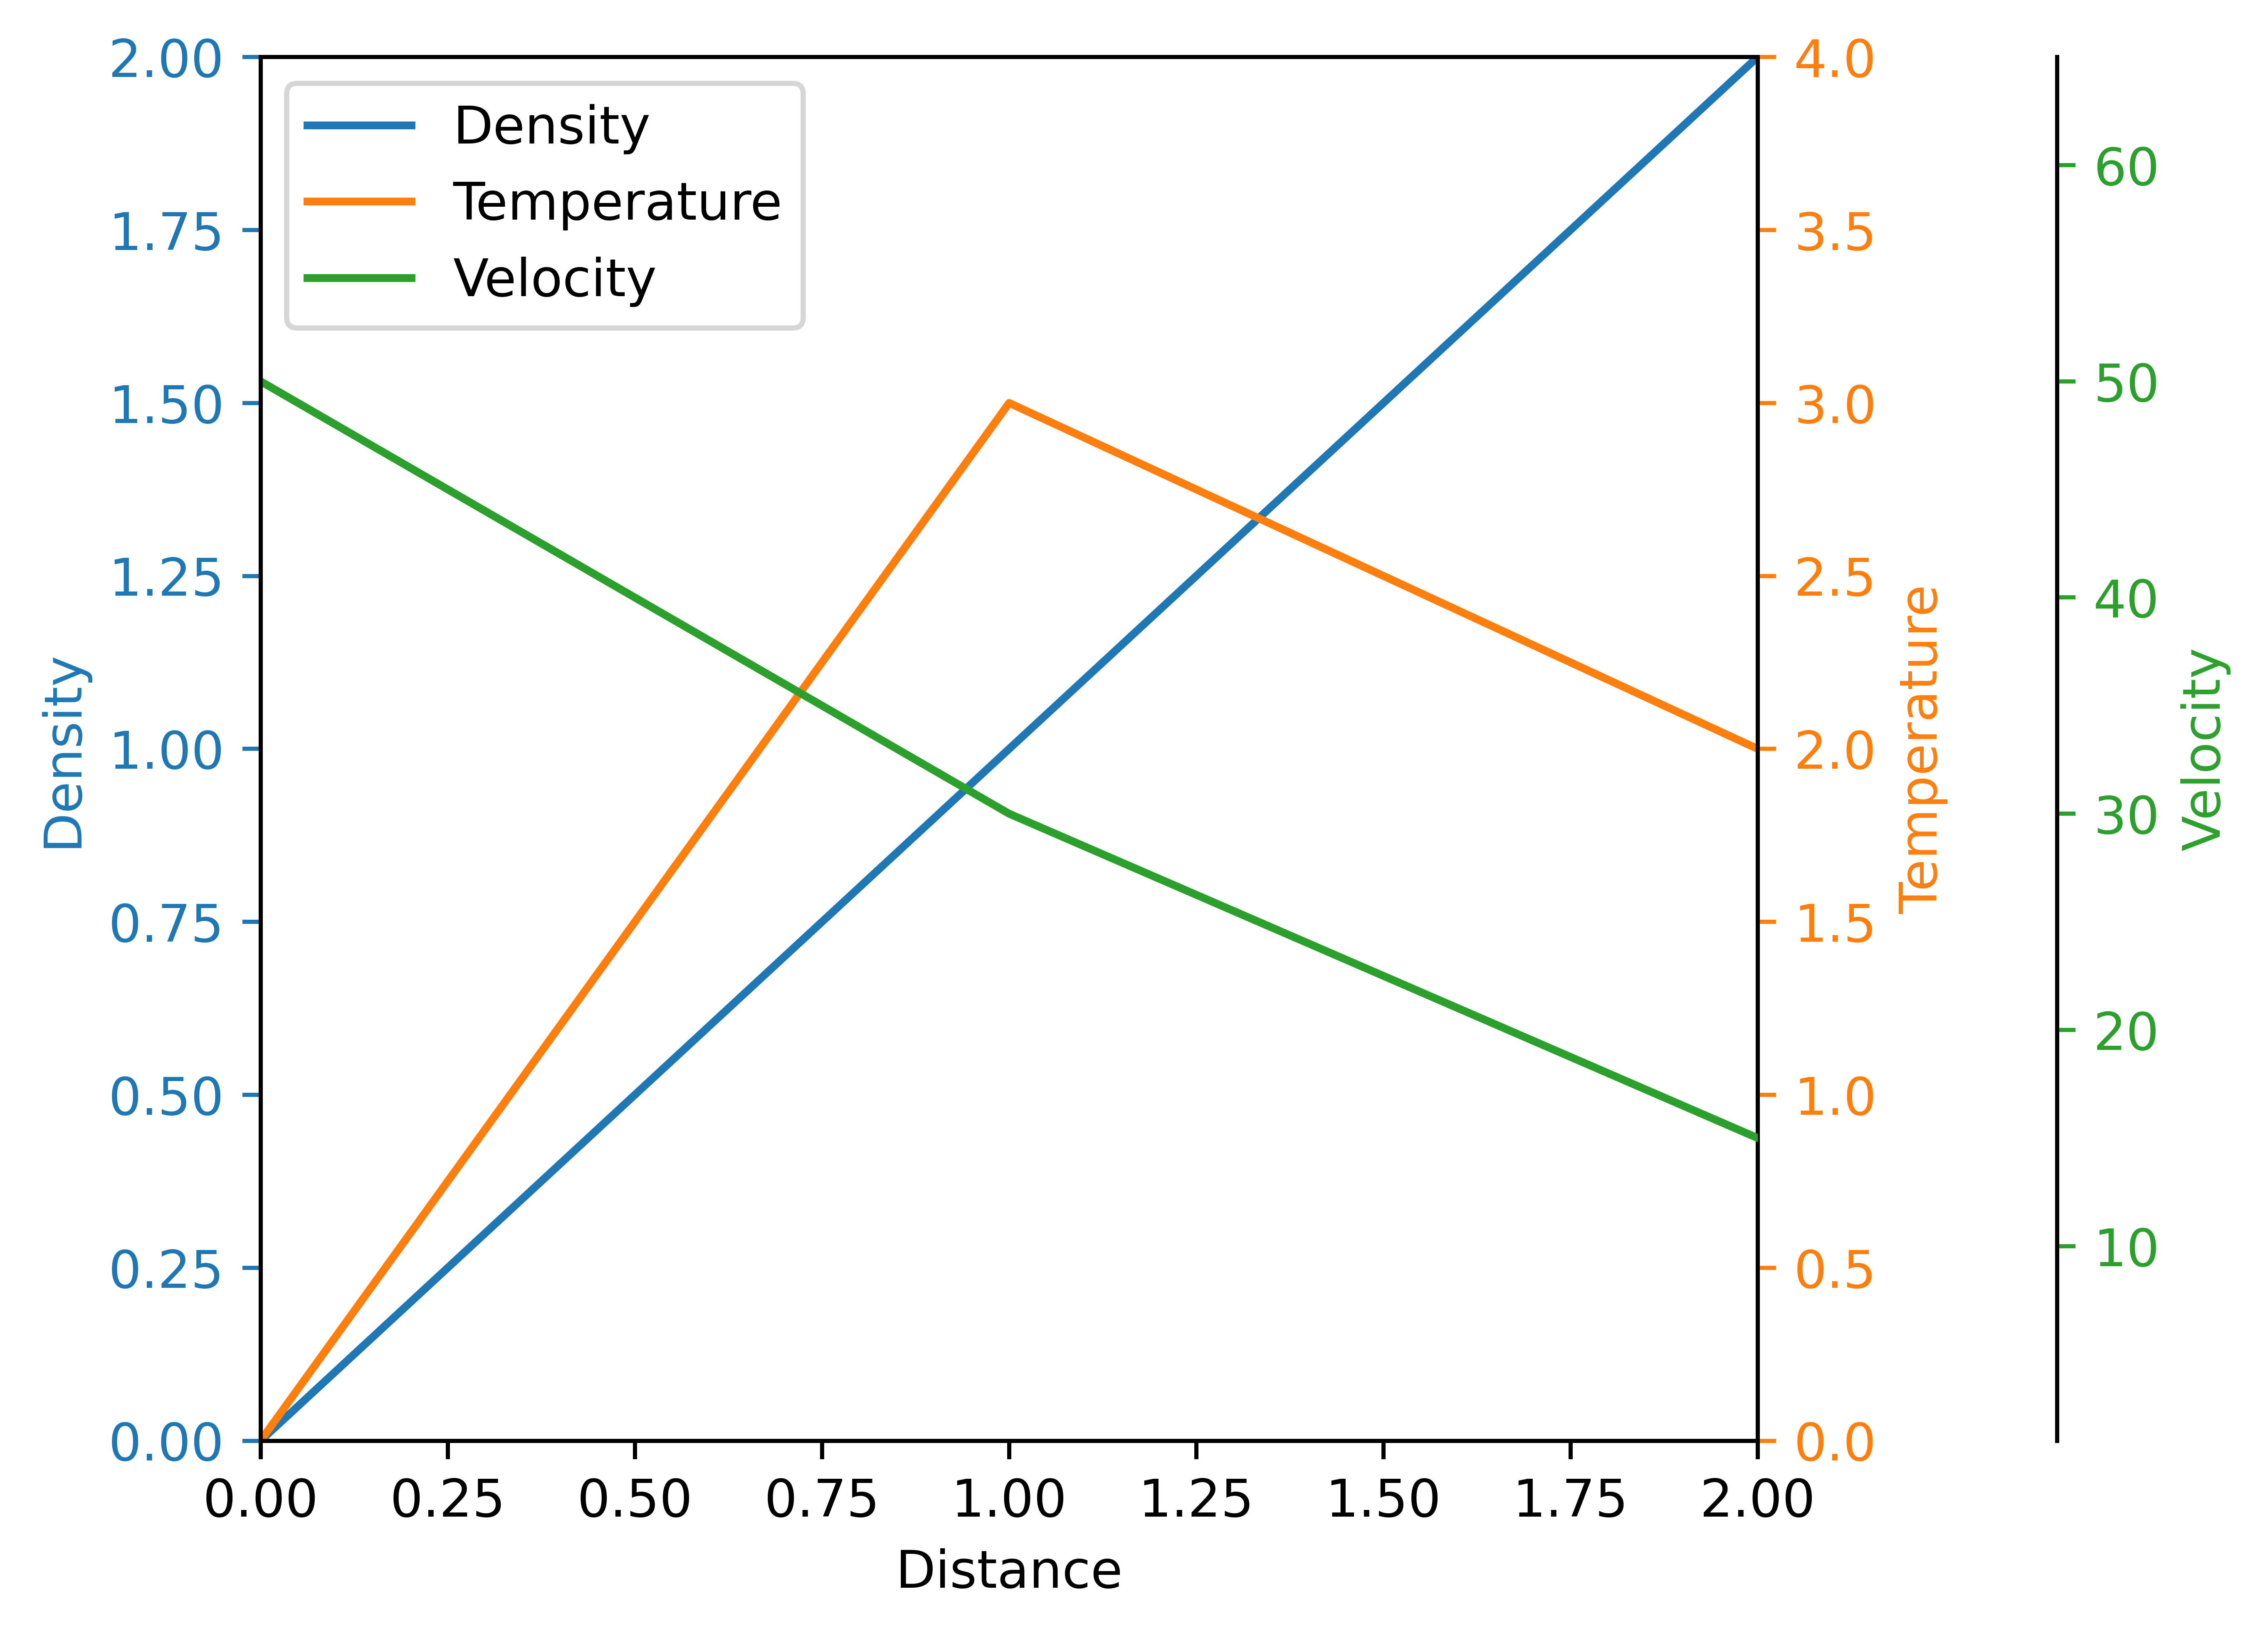
In Python Matplotlib, we can use matplotlib.axes.Axes.twinx function to create an graph with two/multiple y-axis sharing the same x-axis, by “create a new Axes with an invisible x-axis and an independent y-axis positioned opposite to the original one (i.e. at right).”1 Here are three official examples, “Parasite Simple”2, “Parasite axis demo”3, and “Multiple y-axis with Spines”4:
1
2
3
4
5
6
7
8
9
10
11
12
13
14
15
16
17
18
19
20
21
import matplotlib.pyplot as plt
from mpl_toolkits.axes_grid1 import host_subplot
%config InlineBackend.figure_format = 'svg'

host = host_subplot(111)
par = host.twinx()

host.set_xlabel("Distance")
host.set_ylabel("Density")
par.set_ylabel("Temperature")

p1, = host.plot([0, 1, 2], [0, 1, 2], label="Density")
p2, = par.plot([0, 1, 2], [0, 3, 2], label="Temperature")

host.legend(labelcolor="linecolor")

host.yaxis.get_label().set_color(p1.get_color())
par.yaxis.get_label().set_color(p2.get_color())

plt.savefig("fig1.png", dpi=900, bbox_inches='tight')
plt.show()
1
2
3
4
5
6
7
8
9
10
11
12
13
14
15
16
17
18
19
20
21
22
23
24
25
26
27
28
29
30
31
32
import matplotlib.pyplot as plt
from mpl_toolkits import axisartist
from mpl_toolkits.axes_grid1 import host_subplot
%config InlineBackend.figure_format = 'svg'

host = host_subplot(111, axes_class=axisartist.Axes)
plt.subplots_adjust(right=0.75)

par1 = host.twinx()
par2 = host.twinx()

par2.axis["right"] = par2.new_fixed_axis(loc="right", offset=(60, 0))

par1.axis["right"].toggle(all=True)
par2.axis["right"].toggle(all=True)

p1, = host.plot([0, 1, 2], [0, 1, 2], label="Density")
p2, = par1.plot([0, 1, 2], [0, 3, 2], label="Temperature")
p3, = par2.plot([0, 1, 2], [50, 30, 15], label="Velocity")

host.set(xlim=(0, 2), ylim=(0, 2), xlabel="Distance", ylabel="Density")
par1.set(ylim=(0, 4), ylabel="Temperature")
par2.set(ylim=(1, 65), ylabel="Velocity")

host.legend()

host.axis["left"].label.set_color(p1.get_color())
par1.axis["right"].label.set_color(p2.get_color())
par2.axis["right"].label.set_color(p3.get_color())

plt.savefig("fig2.png", dpi=900, bbox_inches='tight')
plt.show()
1
2
3
4
5
6
7
8
9
10
11
12
13
14
15
16
17
18
19
20
21
22
23
24
25
26
27
28
29
30
31
32
33
import matplotlib.pyplot as plt
%config InlineBackend.figure_format = 'svg'

fig, ax = plt.subplots()
fig.subplots_adjust(right=0.75)

twin1 = ax.twinx()
twin2 = ax.twinx()

# Offset the right spine of twin2.  The ticks and label have already been
# placed on the right by twinx above.
twin2.spines.right.set_position(("axes", 1.2))

p1, = ax.plot([0, 1, 2], [0, 1, 2], "C0", label="Density")
p2, = twin1.plot([0, 1, 2], [0, 3, 2], "C1", label="Temperature")
p3, = twin2.plot([0, 1, 2], [50, 30, 15], "C2", label="Velocity")

ax.set(xlim=(0, 2), ylim=(0, 2), xlabel="Distance", ylabel="Density")
twin1.set(ylim=(0, 4), ylabel="Temperature")
twin2.set(ylim=(1, 65), ylabel="Velocity")

ax.yaxis.label.set_color(p1.get_color())
twin1.yaxis.label.set_color(p2.get_color())
twin2.yaxis.label.set_color(p3.get_color())

ax.tick_params(axis='y', colors=p1.get_color())
twin1.tick_params(axis='y', colors=p2.get_color())
twin2.tick_params(axis='y', colors=p3.get_color())

ax.legend(handles=[p1, p2, p3])

plt.savefig("fig3.png", dpi=900, bbox_inches='tight')
plt.show()
References