Specify Order of Layers and Legend Labels using Python Matplotlib
Nov. 03, 2024 • Updated Nov. 03, 2024
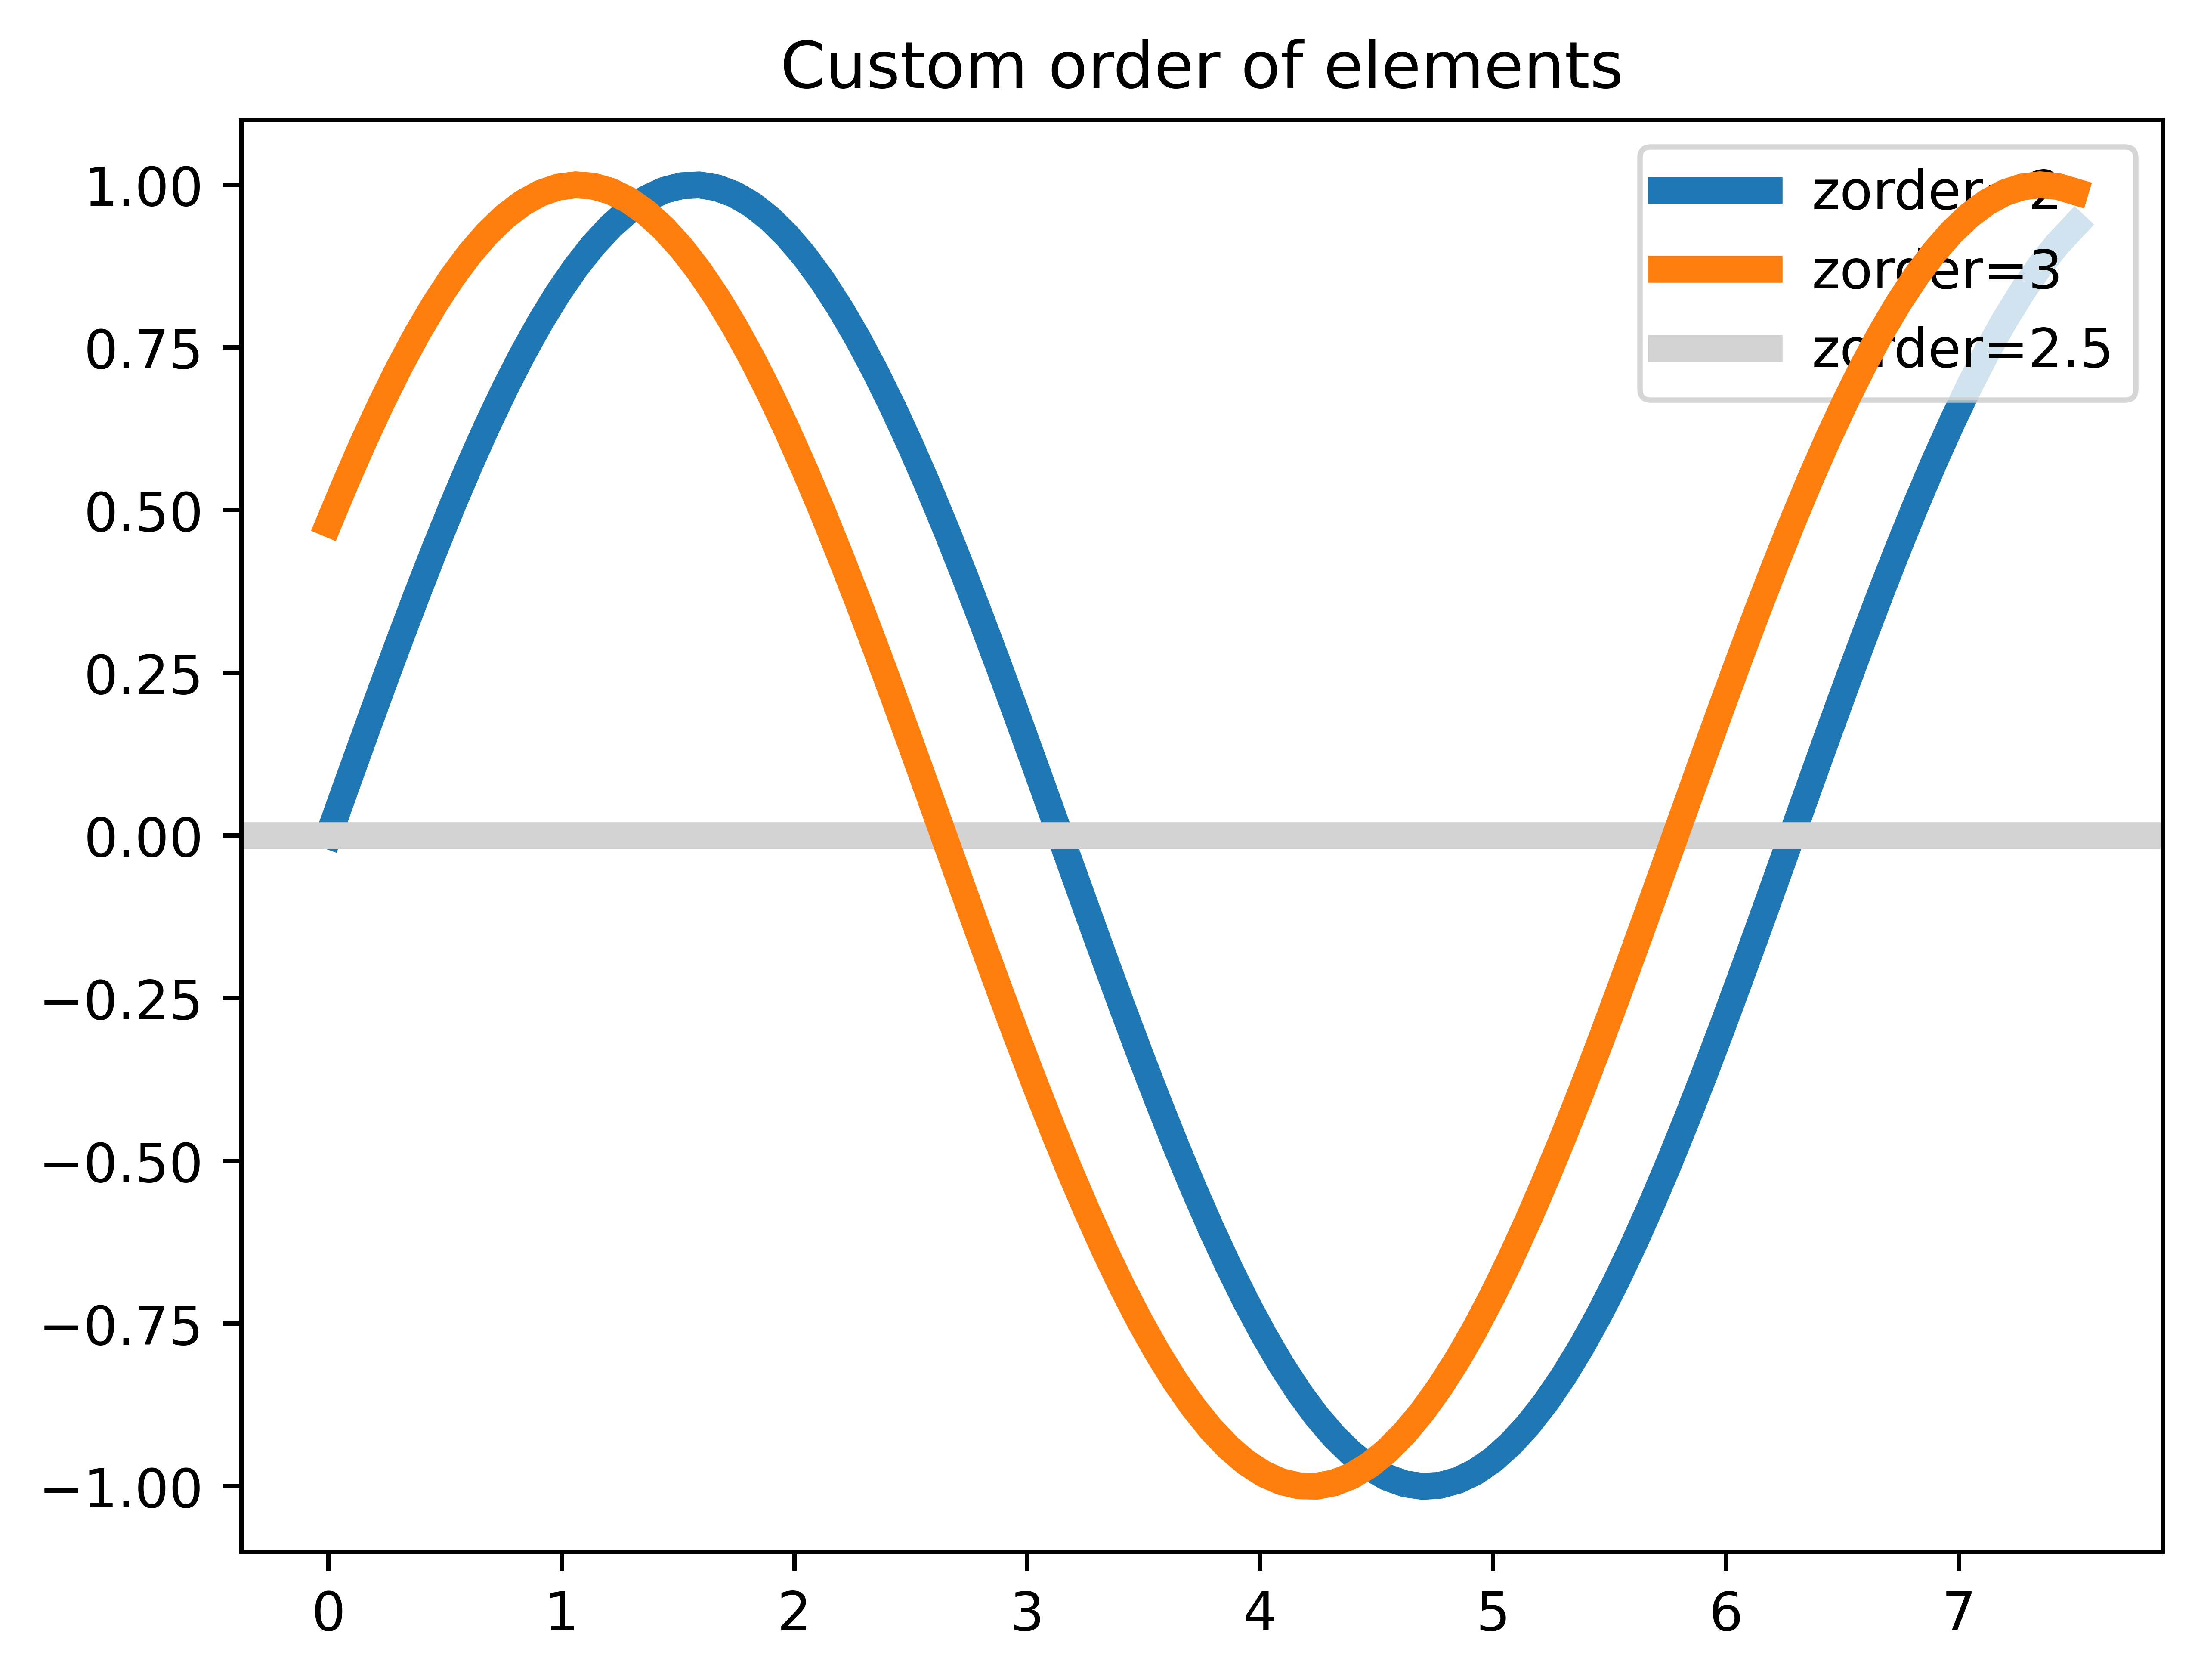
Specify oder of layers by zorder property1:
1
2
3
4
5
6
7
8
9
10
11
12
13
14
15
16
17
18
19
20
import matplotlib.pyplot as plt
%config InlineBackend.figure_format = 'svg'

import numpy as np

x = np.linspace(0, 7.5, 100)

plt.figure()
plt.rcParams['lines.linewidth'] = 5

plt.plot(x, np.sin(x), label='zorder=2', zorder=2)
plt.plot(x, np.sin(x+0.5), label='zorder=3',  zorder=3)
plt.axhline(0, label='zorder=2.5', color='lightgrey', zorder=2.5)
plt.title('Custom order of elements')

l = plt.legend(loc='upper right')
l.set_zorder(2.5)

plt.savefig("fig1.png", dpi=900, bbox_inches='tight')
plt.show()
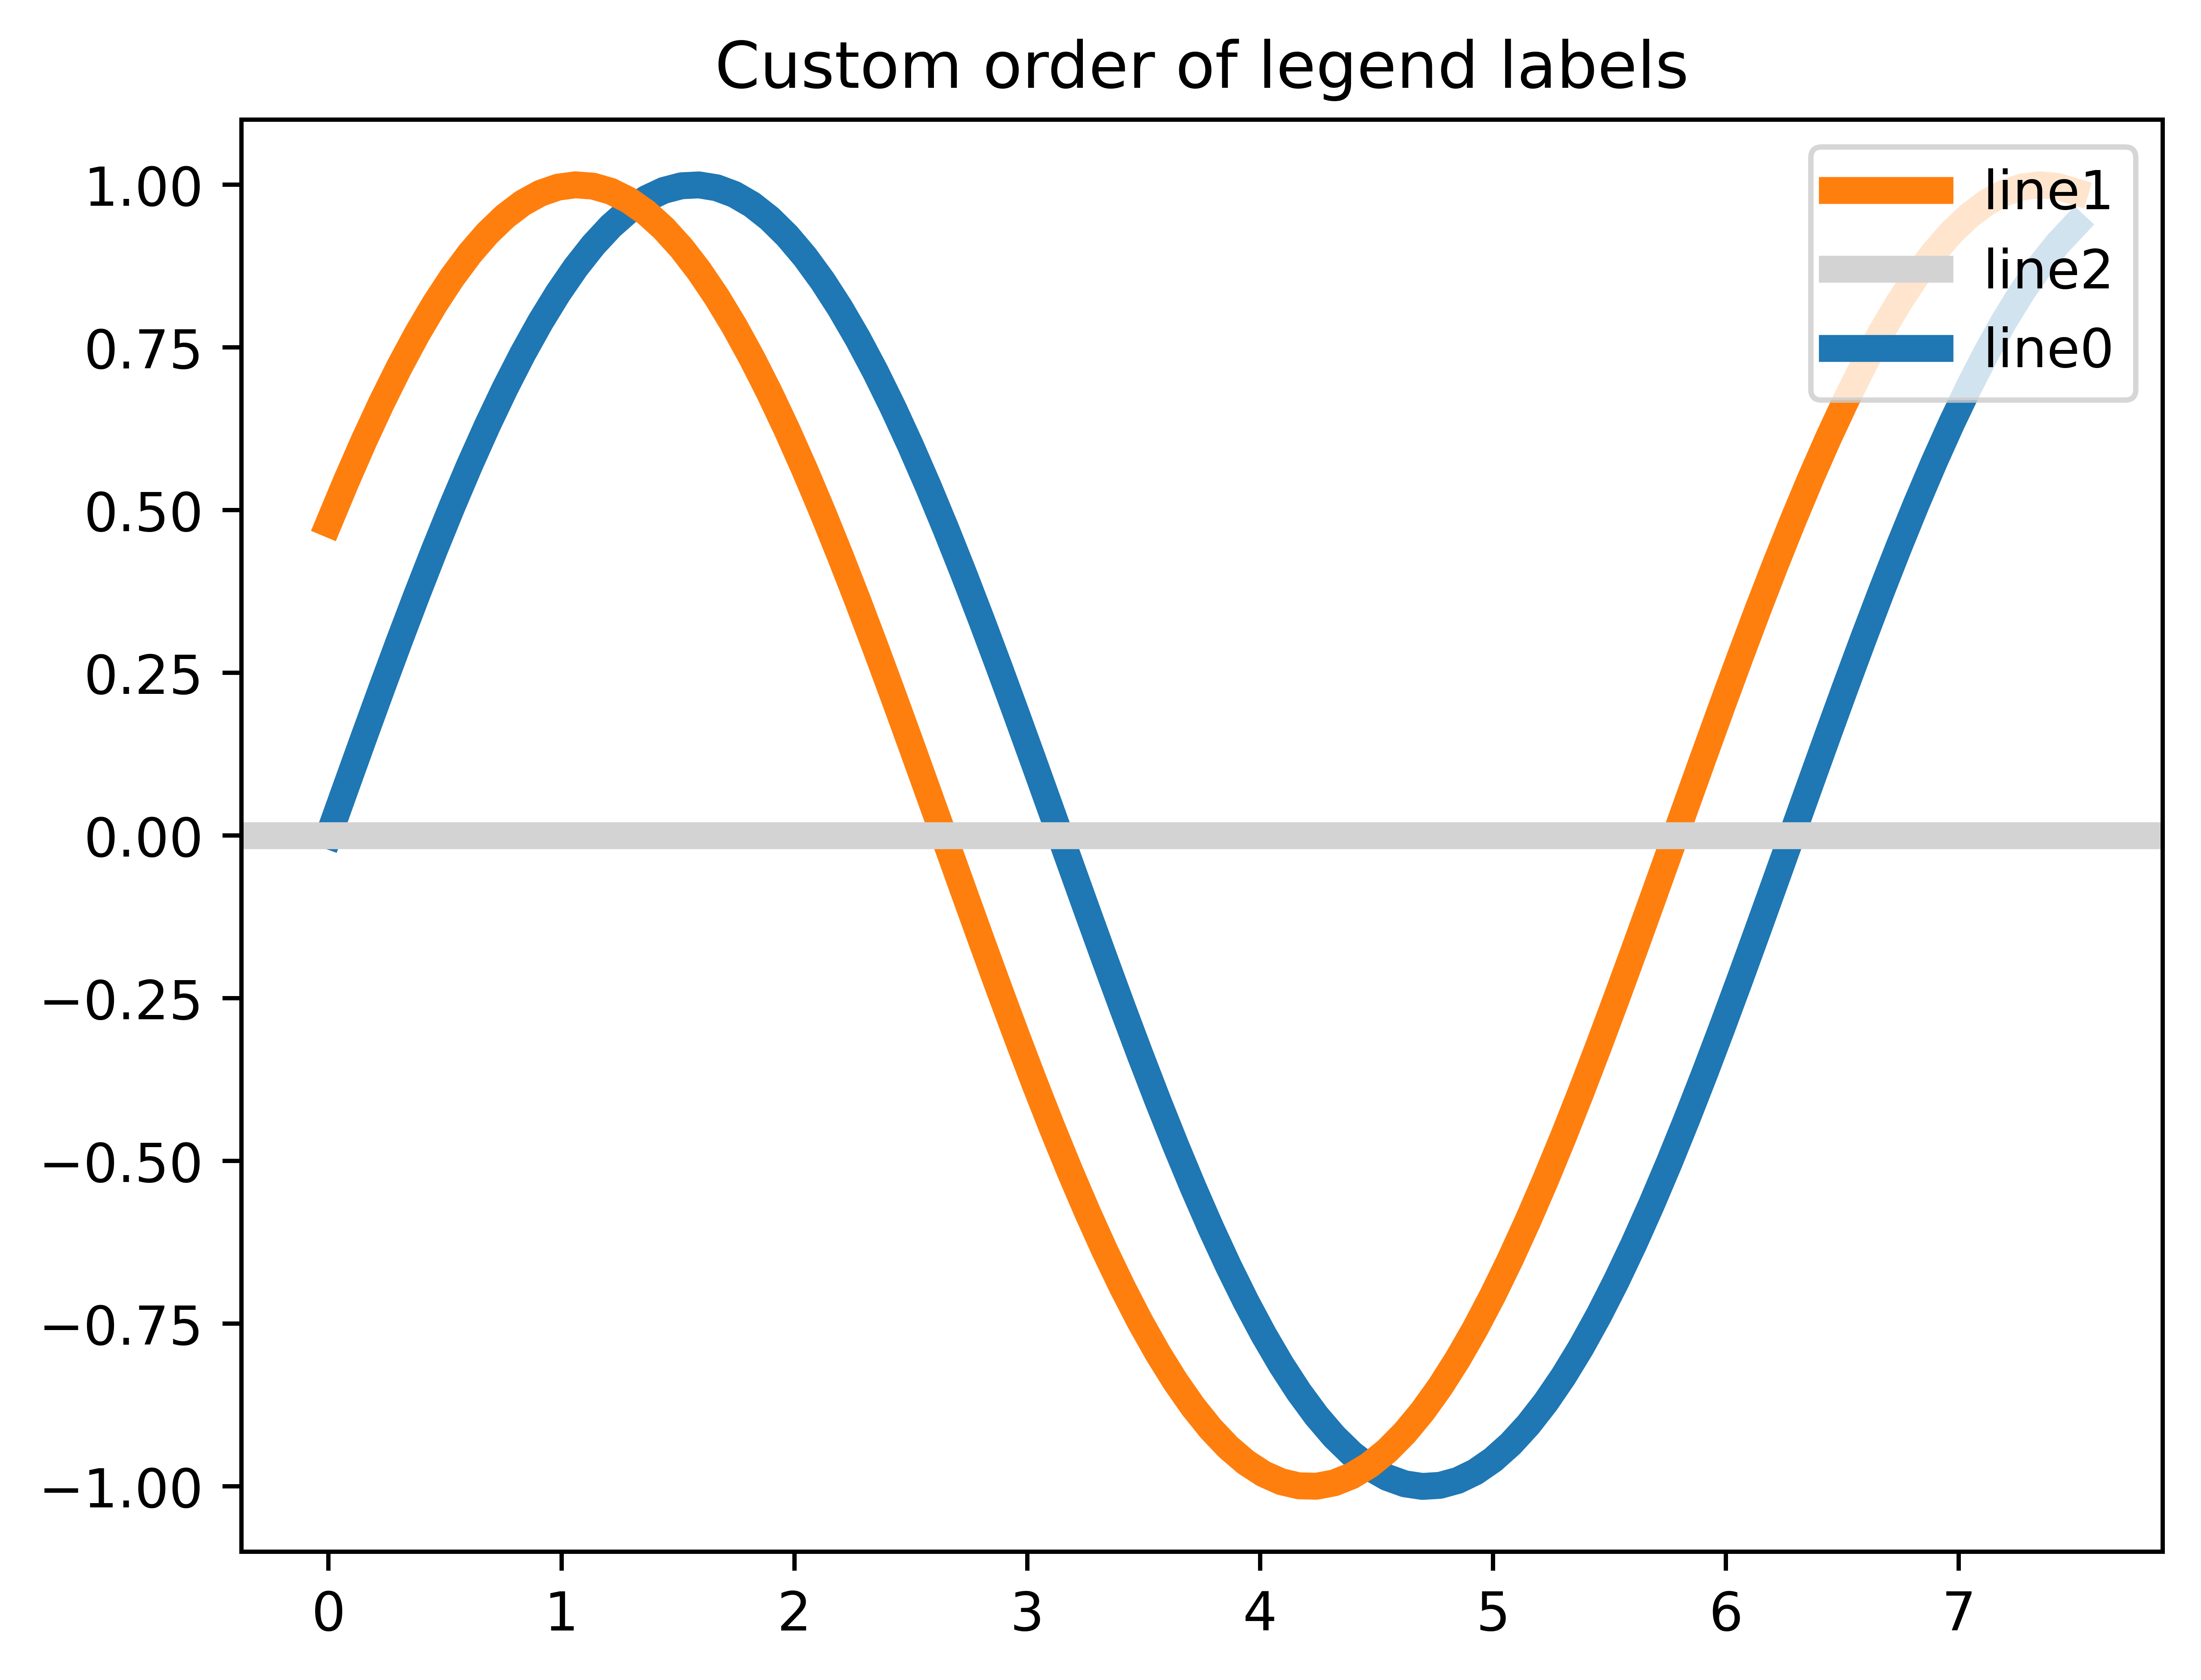
Specify oder of legend labels2:
1
2
3
4
5
6
7
8
9
10
11
12
13
14
15
16
17
18
19
20
21
import matplotlib.pyplot as plt
%config InlineBackend.figure_format = 'svg'

import numpy as np

x = np.linspace(0, 7.5, 100)

plt.figure()
plt.rcParams['lines.linewidth'] = 5

plt.plot(x, np.sin(x), label='line0')
plt.plot(x, np.sin(x+0.5), label='line1')
plt.axhline(0, label='line2', color='lightgrey')
plt.title('Custom order of legend labels')

handles, labels = plt.gca().get_legend_handles_labels()
order = [1, 2, 0]
plt.legend([handles[i] for i in order], [labels[i] for i in order], loc='upper right')

plt.savefig("fig2.png", dpi=900, bbox_inches='tight')
plt.show()
References