Create Multiple Subplots using Python Matplotlib plt.subplots
Nov. 03, 2024 • Updated Nov. 03, 2024
1
2
3
4
5
6
7
8
9
10
11
12
13
14
15
16
17
18
19
20
21
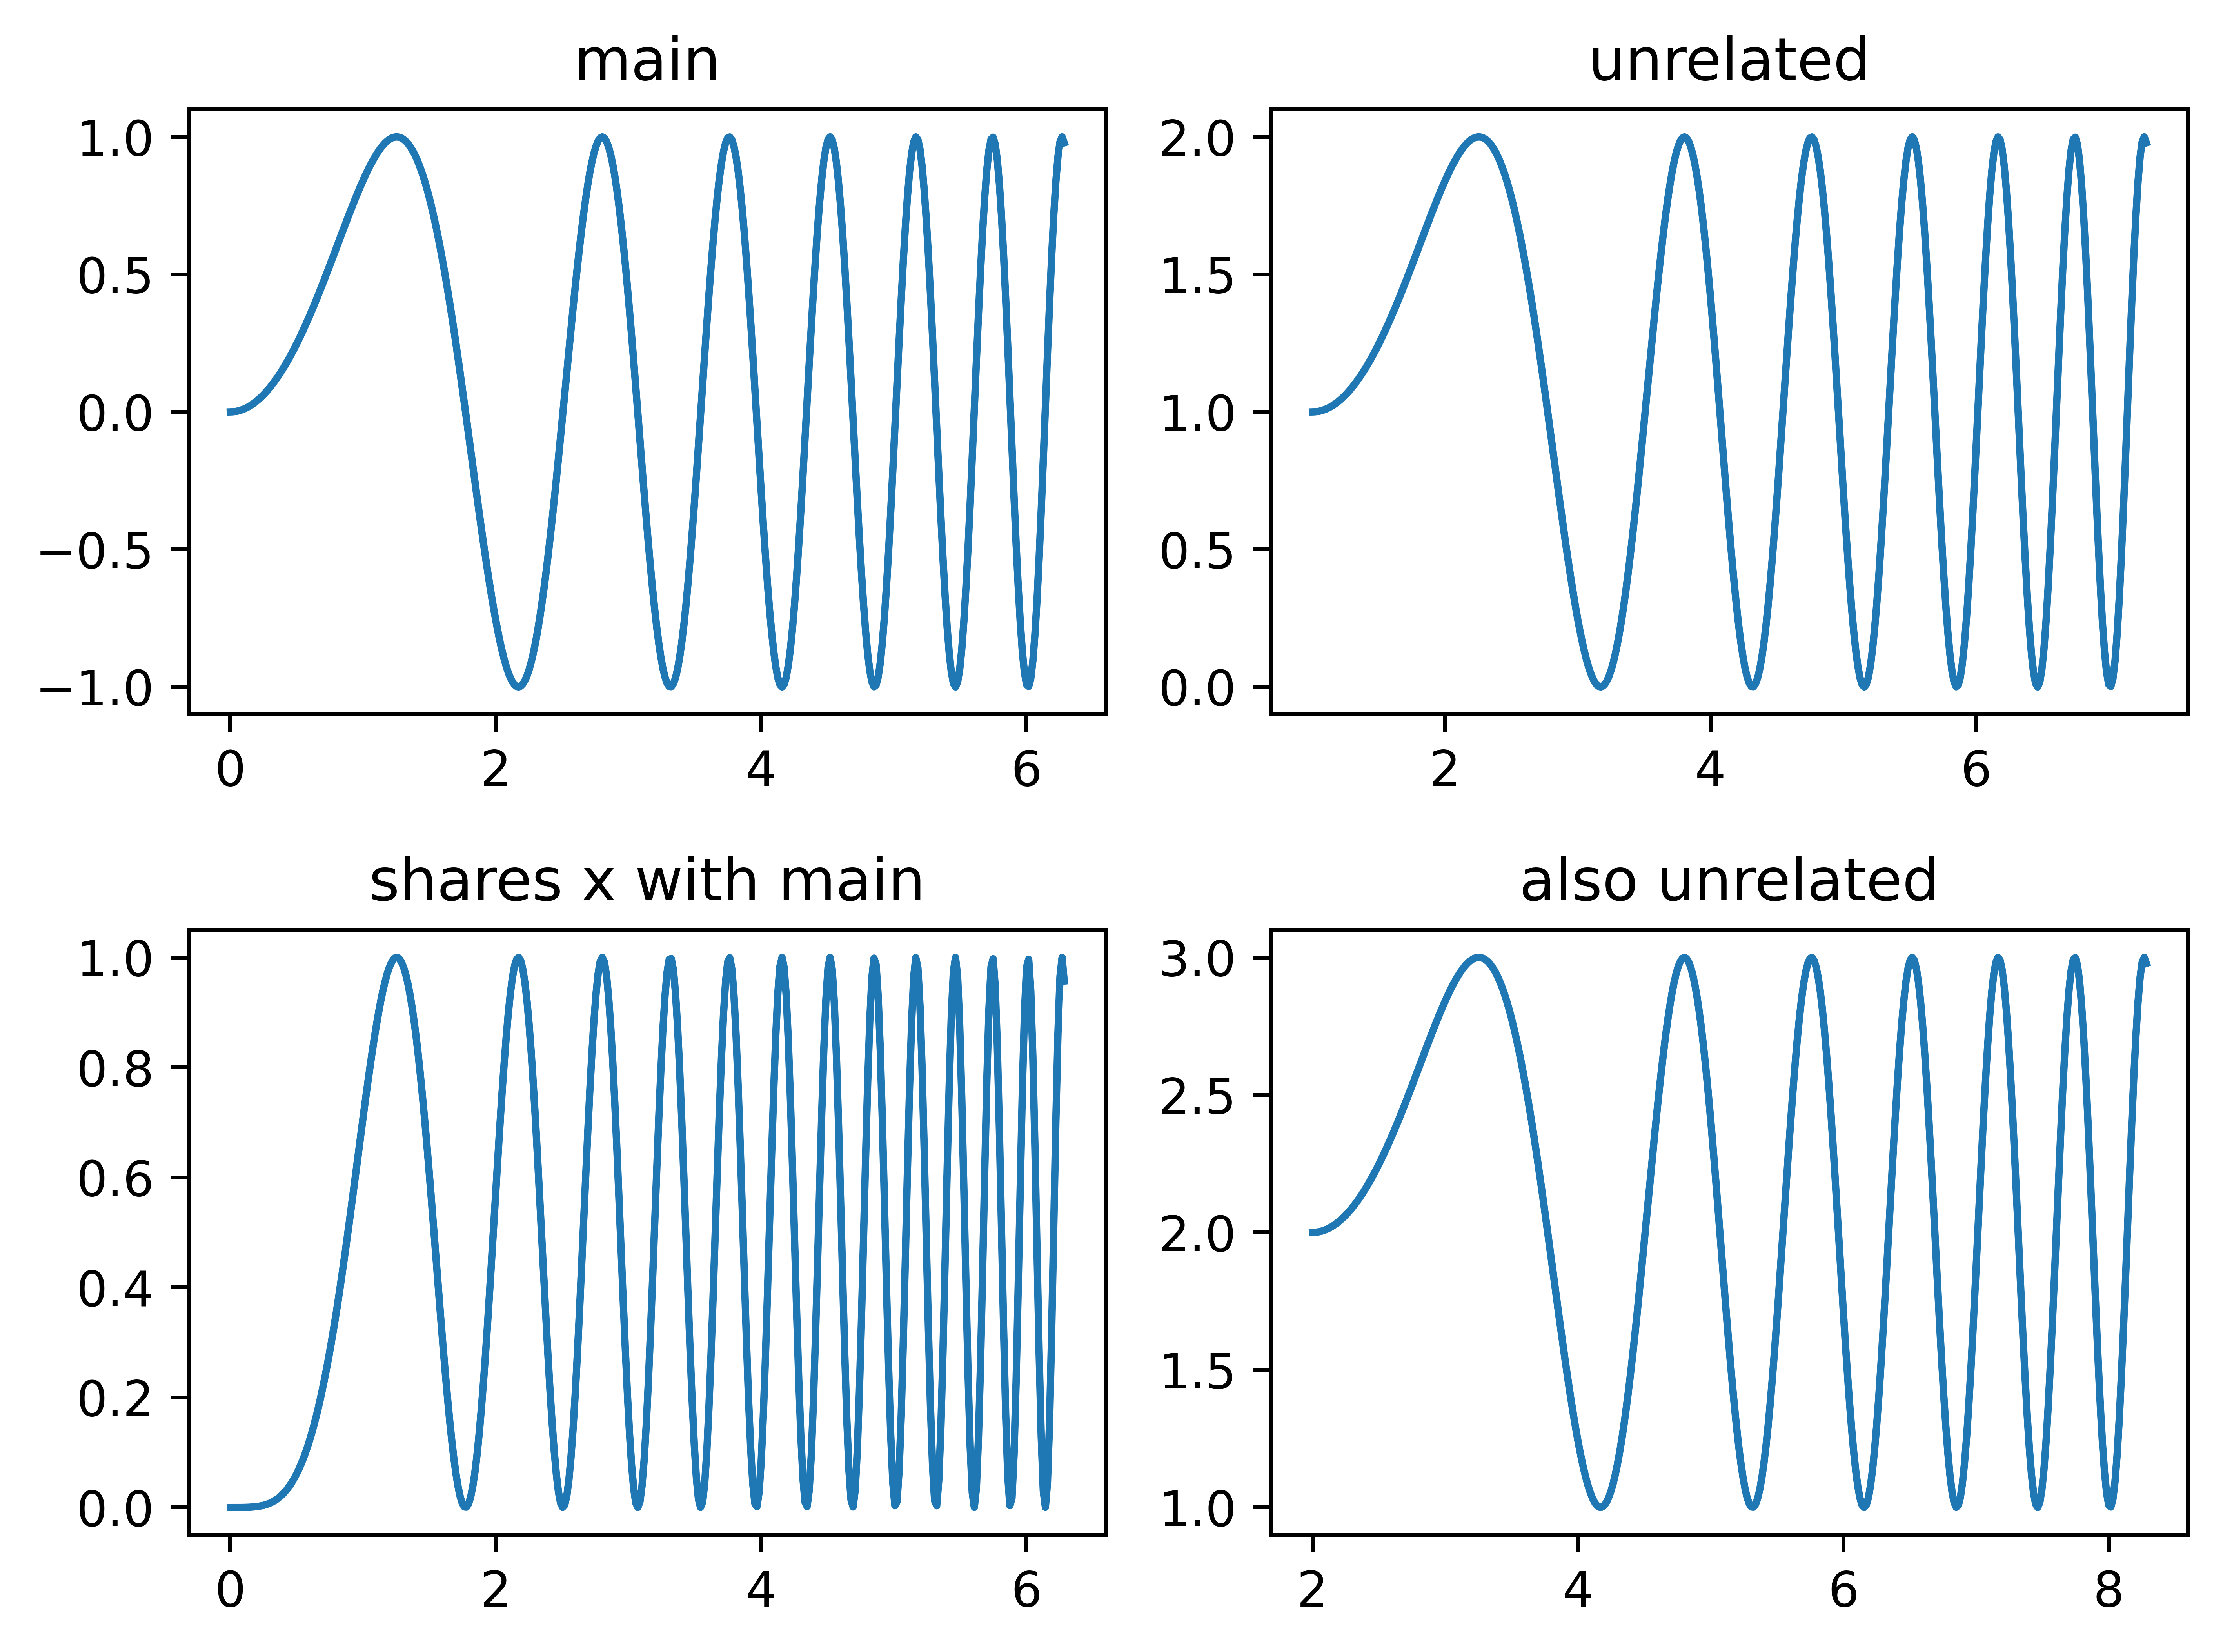
import matplotlib.pyplot as plt
%config InlineBackend.figure_format = 'svg'
import numpy as np
x = np.linspace(0, 2 * np.pi, 400)
y = np.sin(x ** 2)
fig, axs = plt.subplots(2, 2)
axs[0, 0].plot(x, y)
axs[0, 0].set_title("main")
axs[1, 0].plot(x, y**2)
axs[1, 0].set_title("shares x with main")
axs[1, 0].sharex(axs[0, 0])
axs[0, 1].plot(x + 1, y + 1)
axs[0, 1].set_title("unrelated")
axs[1, 1].plot(x + 2, y + 2)
axs[1, 1].set_title("also unrelated")
fig.tight_layout()
plt.savefig("fig1.png", dpi=900, bbox_inches='tight')
plt.show()
1
2
3
4
5
6
7
8
9
10
11
12
13
14
15
16
17
18
19
20
21
22
23
24
25
26
import matplotlib.pyplot as plt
%config InlineBackend.figure_format = 'svg'
import numpy as np

x = np.linspace(0, 2 * np.pi, 400)
y = np.sin(x ** 2)

fig, axs = plt.subplots(2, 2)
axs[0, 0].plot(x, y)
axs[0, 0].set_title('Axis [0, 0]')
axs[0, 1].plot(x, y, 'tab:orange')
axs[0, 1].set_title('Axis [0, 1]')
axs[1, 0].plot(x, -y, 'tab:green')
axs[1, 0].set_title('Axis [1, 0]')
axs[1, 1].plot(x, -y, 'tab:red')
axs[1, 1].set_title('Axis [1, 1]')

for ax in axs.flat:
    ax.set(xlabel='x-label', ylabel='y-label')

# Hide x labels and tick labels for top plots and y ticks for right plots.
for ax in axs.flat:
    ax.label_outer()

plt.savefig("fig2.png", dpi=900, bbox_inches='tight')
plt.show()

References