MATLAB montage Function
Introduction
MATLAB montage function is to “display multiple image frames as rectangular montage”1. It is an efficient way to use this function to organize a set of images, to show a development process, make a comparison between images, or just display several images belonging to a certain collection.
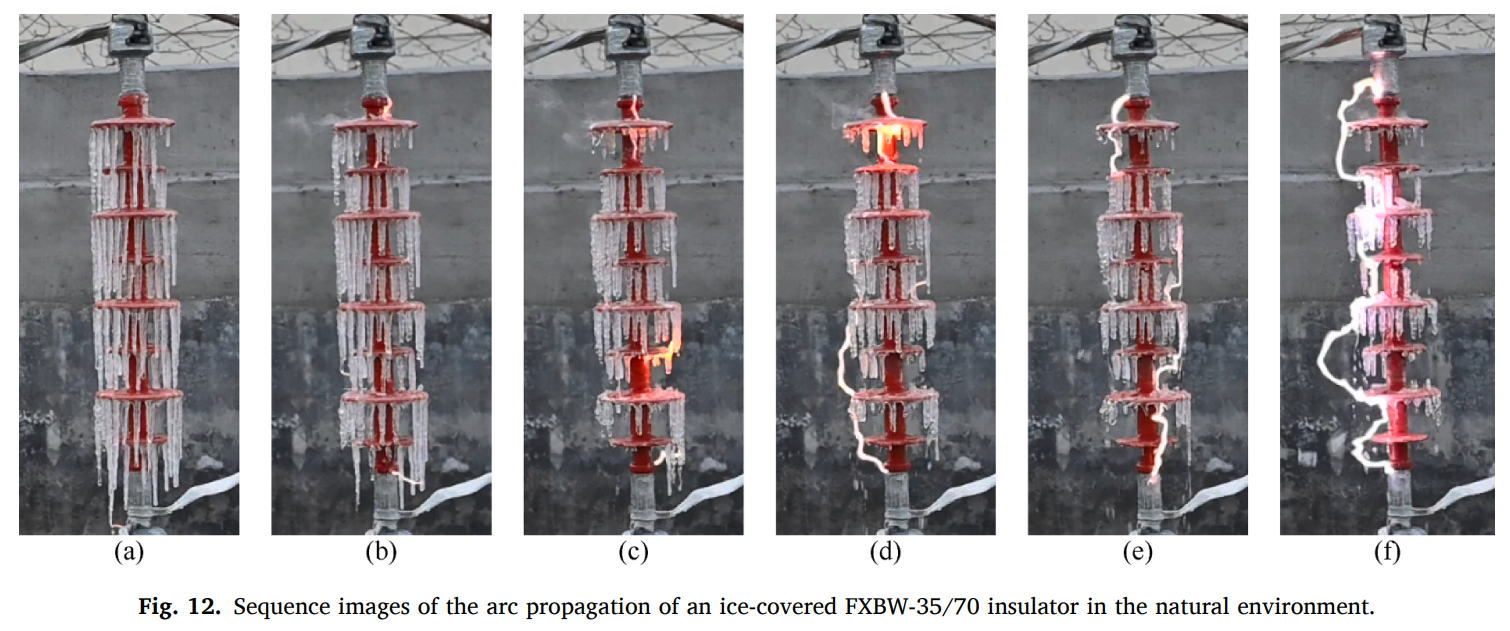
Like in the field of studying discharge and arc, Zong et al. shows the arc development process along an insulator in their paper2:
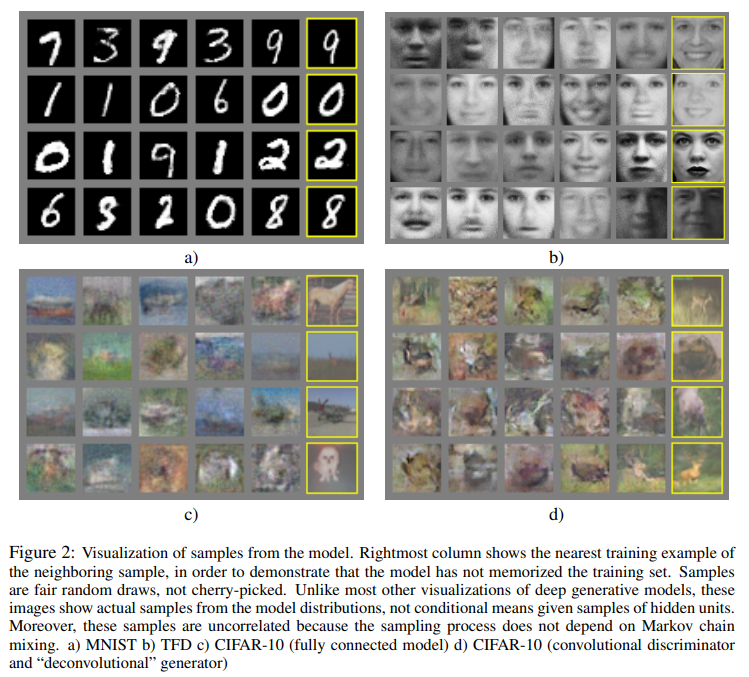
And, in the filed of deep learning, especially computer vision, montage function can be used to arrange and display several images from an identical image data set, just like Goodfellow et al. did in their classical paper, Generative adversarial nets3:
Before, I ever learned some MATLAB examples about deep learning for images, such as Train Generative Adversarial Network (GAN)4 and Train Wasserstein GAN with Gradient Penalty (WGAN-GP)5 (see blogs 6 and 7). In these examples, imtile function (combine multiple image frames into one rectangular tiled image)8, rescale function (scale range of array elements (to $[0,1]$ by default) )9, and image function (display image from array)10 are combined to realize multiple image layout. And finally, we also should use axis off to hide the axis.
Both imtile and image functions are from basic MATLAB Graphics Toolbox, so above workflow is not that concise. Rather, montage function is from Image Processing Toolbox, therefore providing a more professional and elegant way as will be shown in the following text. Therefore, I would take some notes about montage function in this post.
All of following examples are from montage official documentation1, but in the documentation, examples and motage properties are described separately to some extent. Some examples are more appropriate to illustrate some certain properties, so I re-organize contents in the documentation, and intentionally ignore something that I think not commonly used. Basically, the differences between these examples lie in which kind of data structure storing images the montage function read from, and whether or not the images have the same type and size.
MATLAB montage function
Example 1: create montage from multi-frame image (3-D array)
montage function can directly accept the image array as input. Take gray images, which have only one single color channel, as an example:
1
2
3
4
5
6
7
8
9
clc,clear,close all

% Load an MRI dataset
load mristack

% Display the dataset
% `montage` treats the data as a multiframe image and displays each slice
figure("Color","w")
img = montage(mristack);
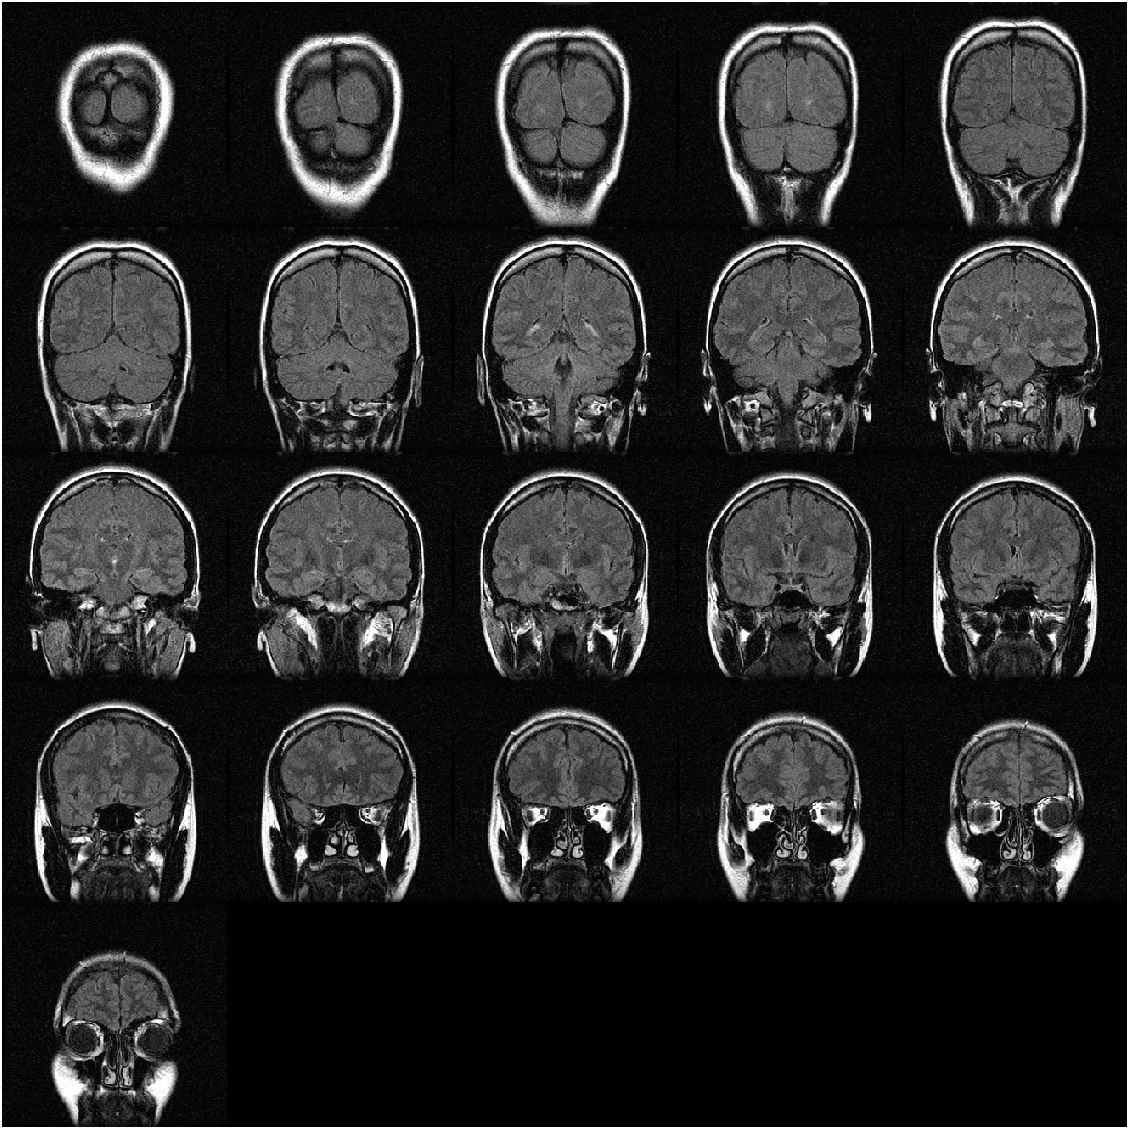
where code load mristack is used to load an MRI (Magnetic Resonance Imaging) data set, which only includes a 3-D uint8-class array mristack storing the pixel data of 21 gray images:
1
2
3
>> whos mristack
  Name            Size                  Bytes  Class    Attributes
  mristack      256x256x21            1376256  uint8
and img is a Image-class variable:
1
2
3
>> whos img
  Name      Size            Bytes  Class                              Attributes
  img       1x1                 8  matlab.graphics.primitive.Image
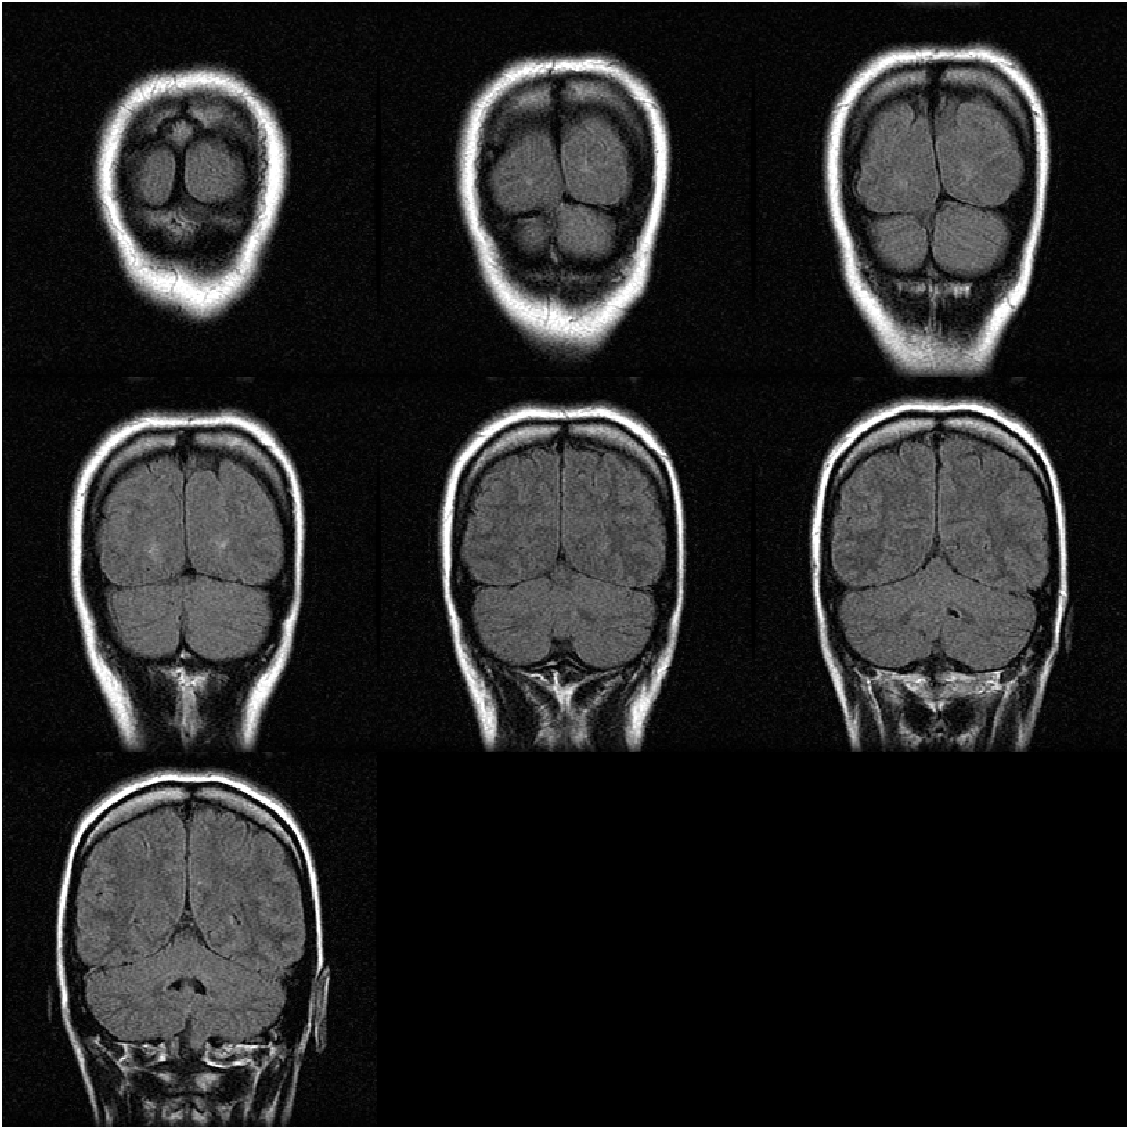
We can specify the number of images to be displayed by setting "Indices" property, like showing the first seven images for example:
1
2
3
4
5
6
7
8
clc,clear,close all

% Load an MRI dataset
load mristack

% Display the first seven images
figure("Color","w")
img = montage(mristack,"Indices",1:7);
Example 2: create montage containing images of different types and sizes
montage function also can be used to process and display images with different types (colorful or gray images) and sizes (with different resolutions):
1
2
3
4
5
6
7
8
9
clc,clear,close all

% Read several images of different types and sizes into the workspace.
imRGB = imread("peppers.png");
imGray = imread("coins.png");

% Display a montage containing all of the images
figure("Color","w")
img = montage({imRGB,imGray,"cameraman.tif"});
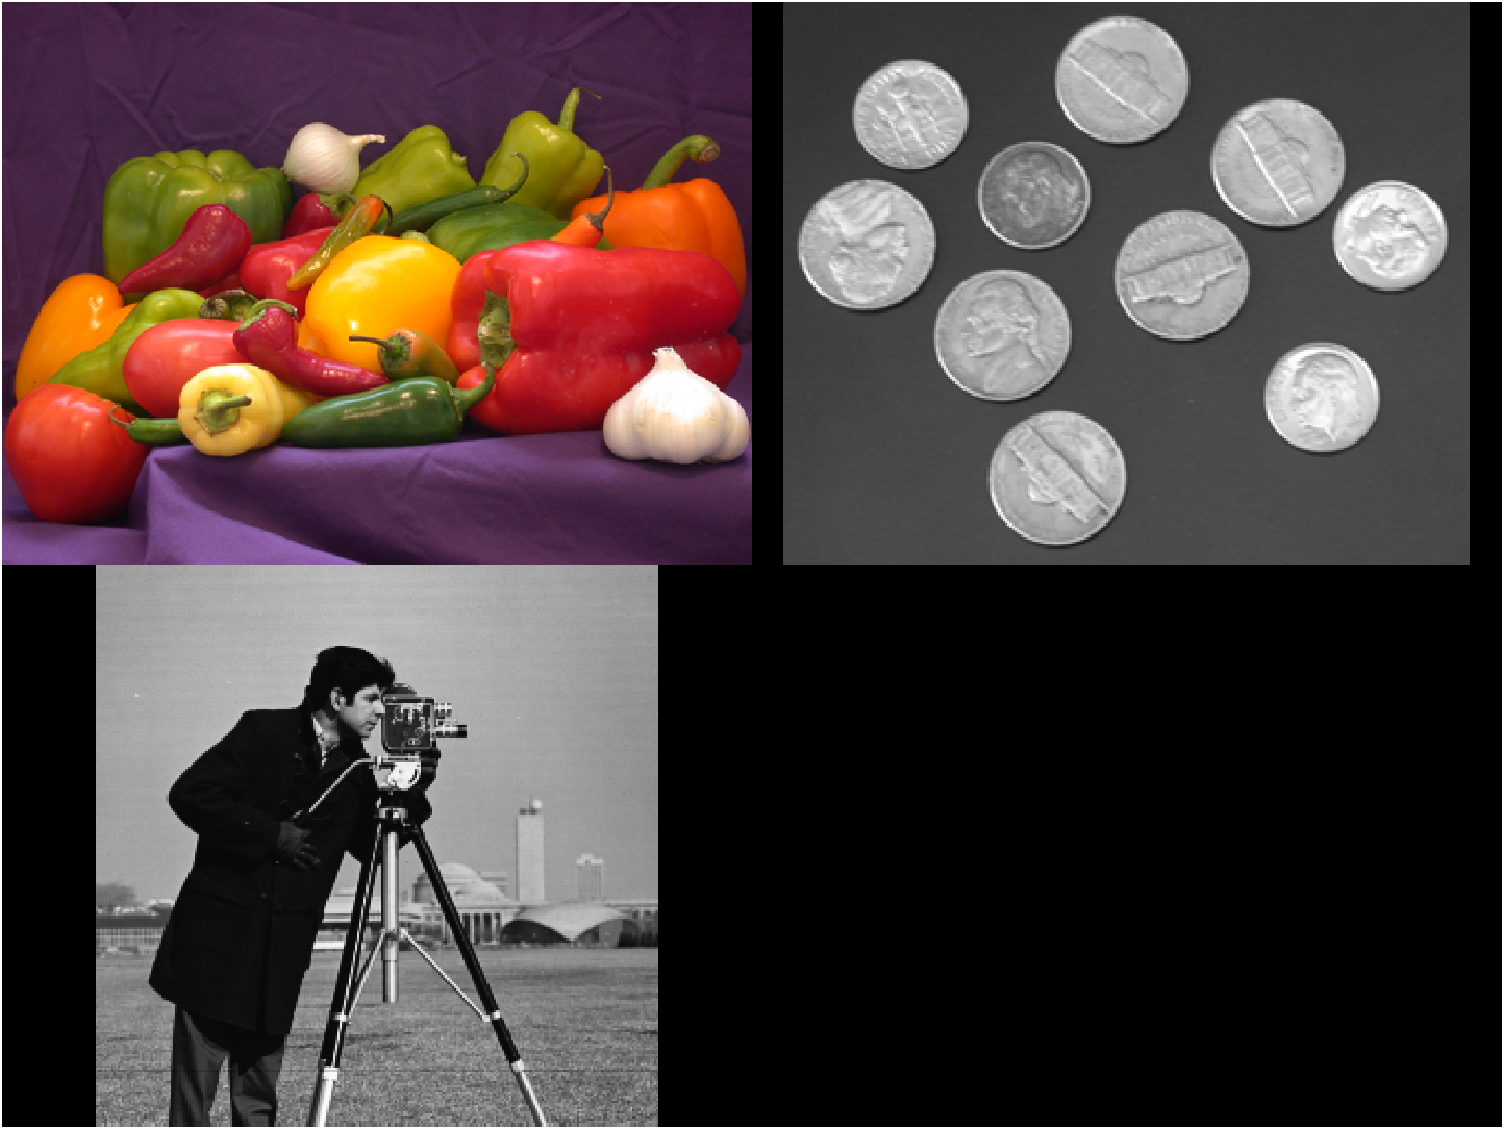
where
1
2
3
4
5
>> whos
  Name          Size                Bytes  Class                              Attributes
  imGray      246x300               73800  uint8
  imRGB       384x512x3            589824  uint8
  img           1x1                     8  matlab.graphics.primitive.Image
As can be seen, imGray is a 2-D array representing a gray image, while imRGB is a 3-D array representing an RGB image. And if we read "cameraman.tif" into the workspace, we could find it is also a gray array, but whose size is different from "coins.png":
1
2
3
4
>> imGray2 = imread("cameraman.tif");
>> whos imGray2
  Name           Size             Bytes  Class    Attributes
  imGray2      256x256            65536  uint8
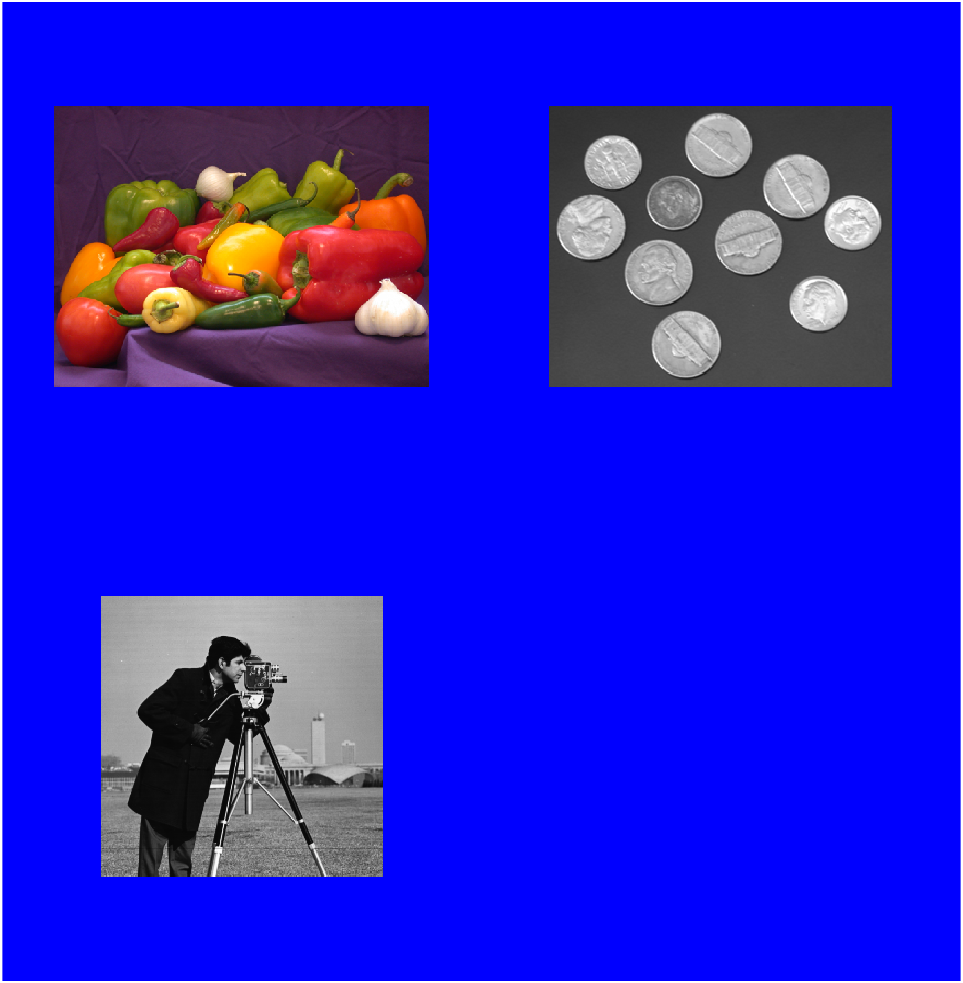
In this case, we can have a look at what properties "BackgroundColor" (default value is "black") and "BorderSize" (default value is [0 0]) determine:
1
2
3
4
5
6
7
8
9
10
clc,clear,close all

% Read several images of different types and sizes into the workspace.
imRGB = imread("peppers.png");
imGray = imread("coins.png");

% Display a montage containing all of the images
figure("Color","w")
img = montage({imRGB,imGray,"cameraman.tif"}, ...
    "BackgroundColor","b","BorderSize",[200,100]);
Example 3: create montage from several image files
Actually, all of three images in Script 1, peppers.png, coins.png, and cameraman.tif, are in the MATLAB default searching path, so it’s okay if we use montage in the following way:
1
2
3
4
5
clc,clear,close all

% Display a montage containing all of the images
figure("Color","w")
img = montage({'peppers.png','coins.png','cameraman.tif'});
At this point, it is also an example showing how to create montage from image files.
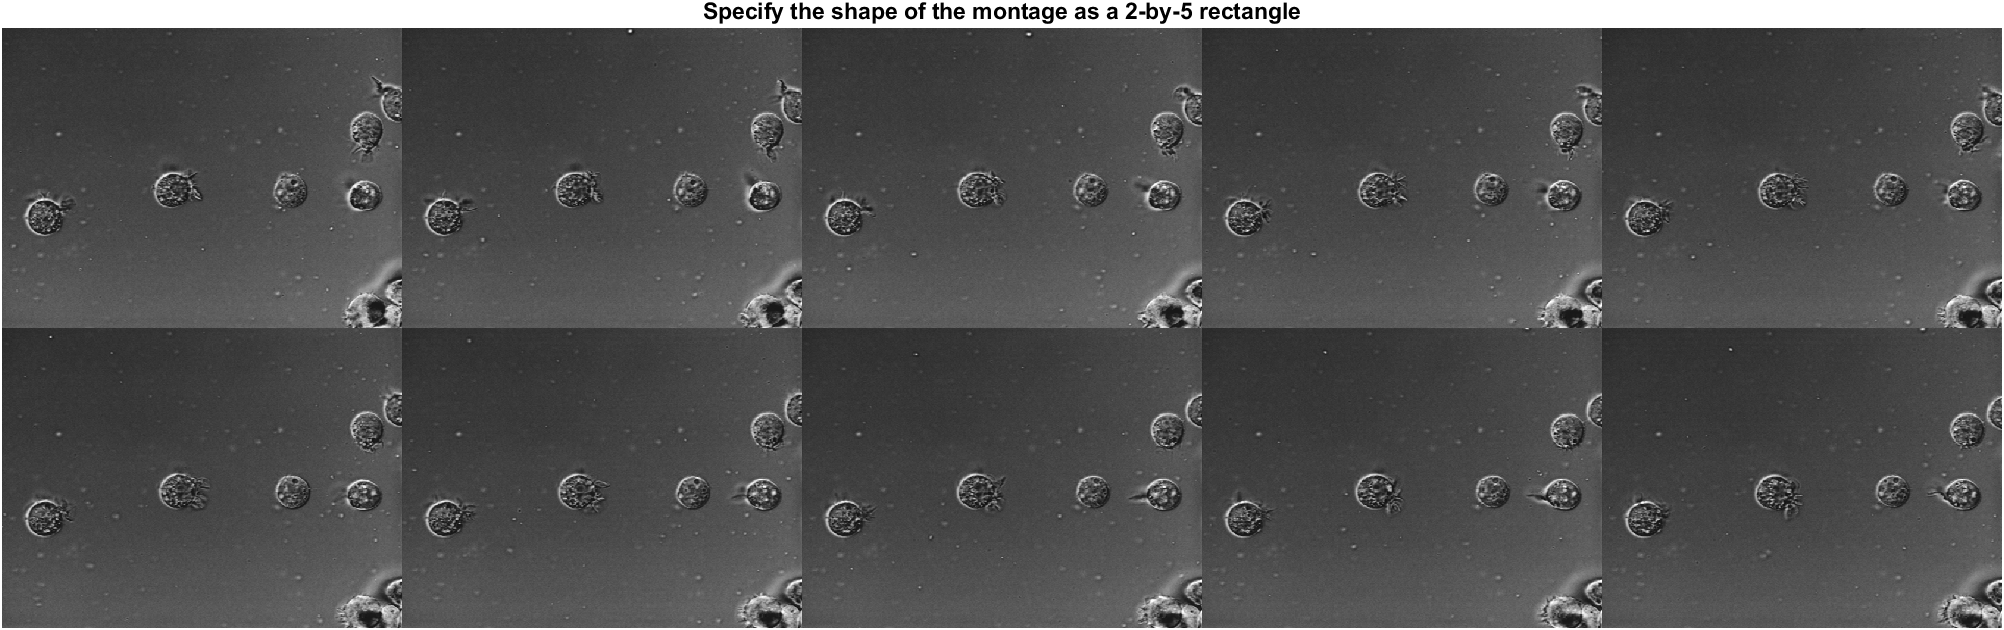
The official documentation provides a more detailed example to show this way. Besides, it also shows the function of "Size" property and "DisplayRange" property:
1
2
3
4
5
6
7
8
9
10
11
12
13
14
15
16
17
clc,clear,close all
% Create a string array containing a series of file names
fileFolder = fullfile(matlabroot,"toolbox","images","imdata");
dirOutput = dir(fullfile(fileFolder,"AT3_1m4_*.tif"));
fileNames = string({dirOutput.name});
% Display the images as a rectangular montage
% Specify the shape of the montage as a 2-by-5 rectangle.
fig1 = figure("Color","w");
montage(fileNames,"Size",[2,5]);
title("Specify the shape of the montage as a 2-by-5 rectangle")
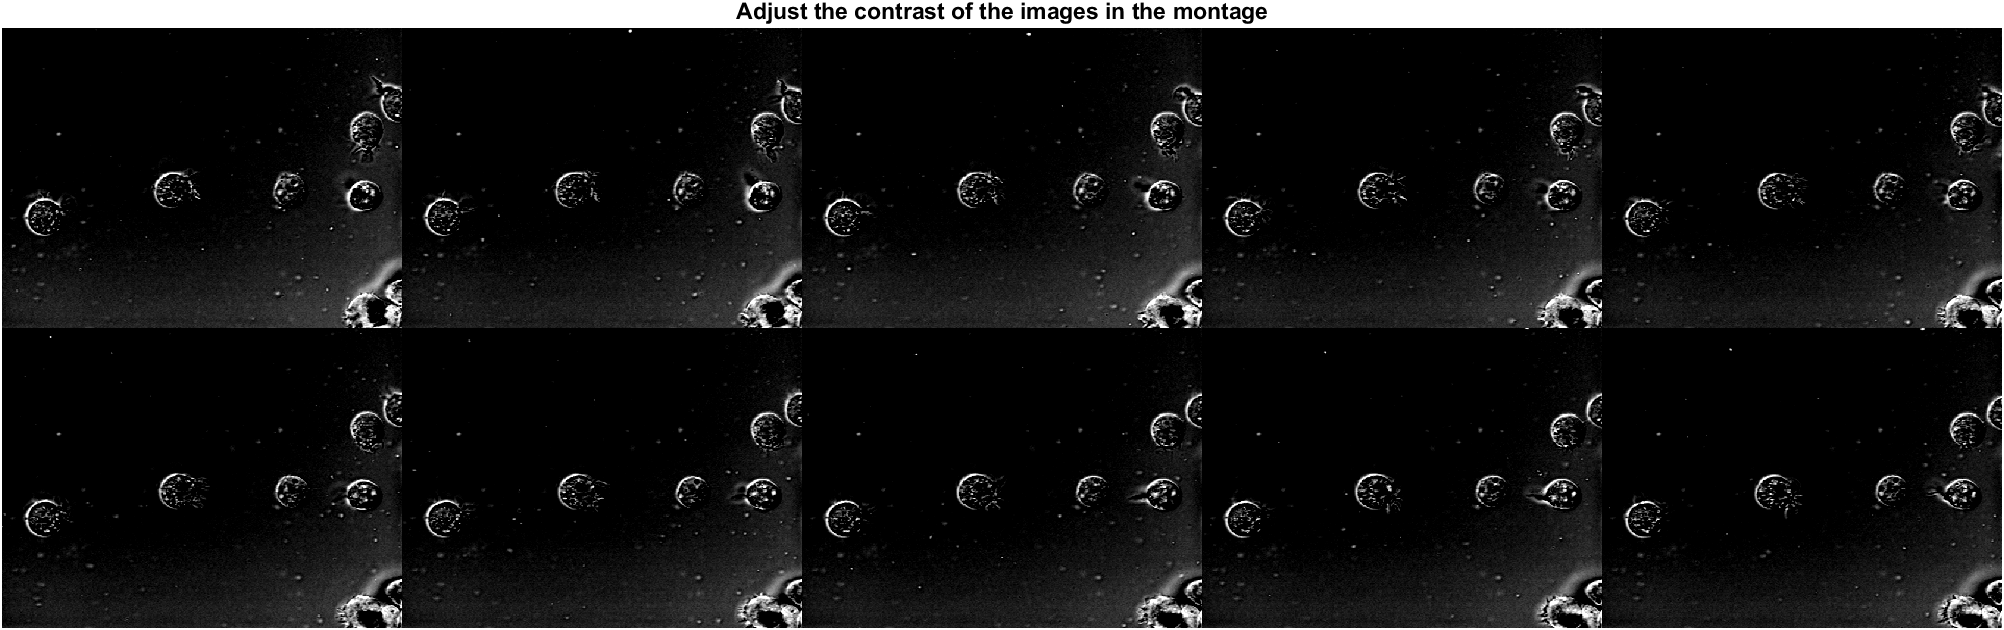
% Adjust the contrast of the images in the montage (ONLY functional for gray images)
fig2 = figure("Color","w");
montage(fileNames,"Size",[2,5],"DisplayRange",[75,200]);
title("Adjust the contrast of the images in the montage")
The first montage is:
and the second one is:
And fileNames is a 1×10 string array:
1
2
3
4
>> fileNames
fileNames =
  1×10 string array
    "AT3_1m4_01.tif"    "AT3_1m4_02.tif"    "AT3_1m4_03.tif"    "AT3_1m4_04.tif"    "AT3_1m4_05.tif"    "AT3_1m4_06.tif"    "AT3_1m4_07.tif"    "AT3_1m4_08.tif"    "AT3_1m4_09.tif"    "AT3_1m4_10.tif"
Note that, as described in the official documentation, "DisplayRange" is to “Display range of grayscale images in array I, specified as 1-by-2 vector of the form [low high]. All pixel values less than or equal to low display as black. All pixel values greater than or equal to high display as white. If you specify an empty matrix ([]), then montage uses the minimum and maximum pixel values of the images.” So, this property is ONLY functional when showing gray images. If some images in the montage is colorful, MATLAB will throw a warning, “Warning: Montage image is a color image. DisplayRange parameter will be ignored. “.
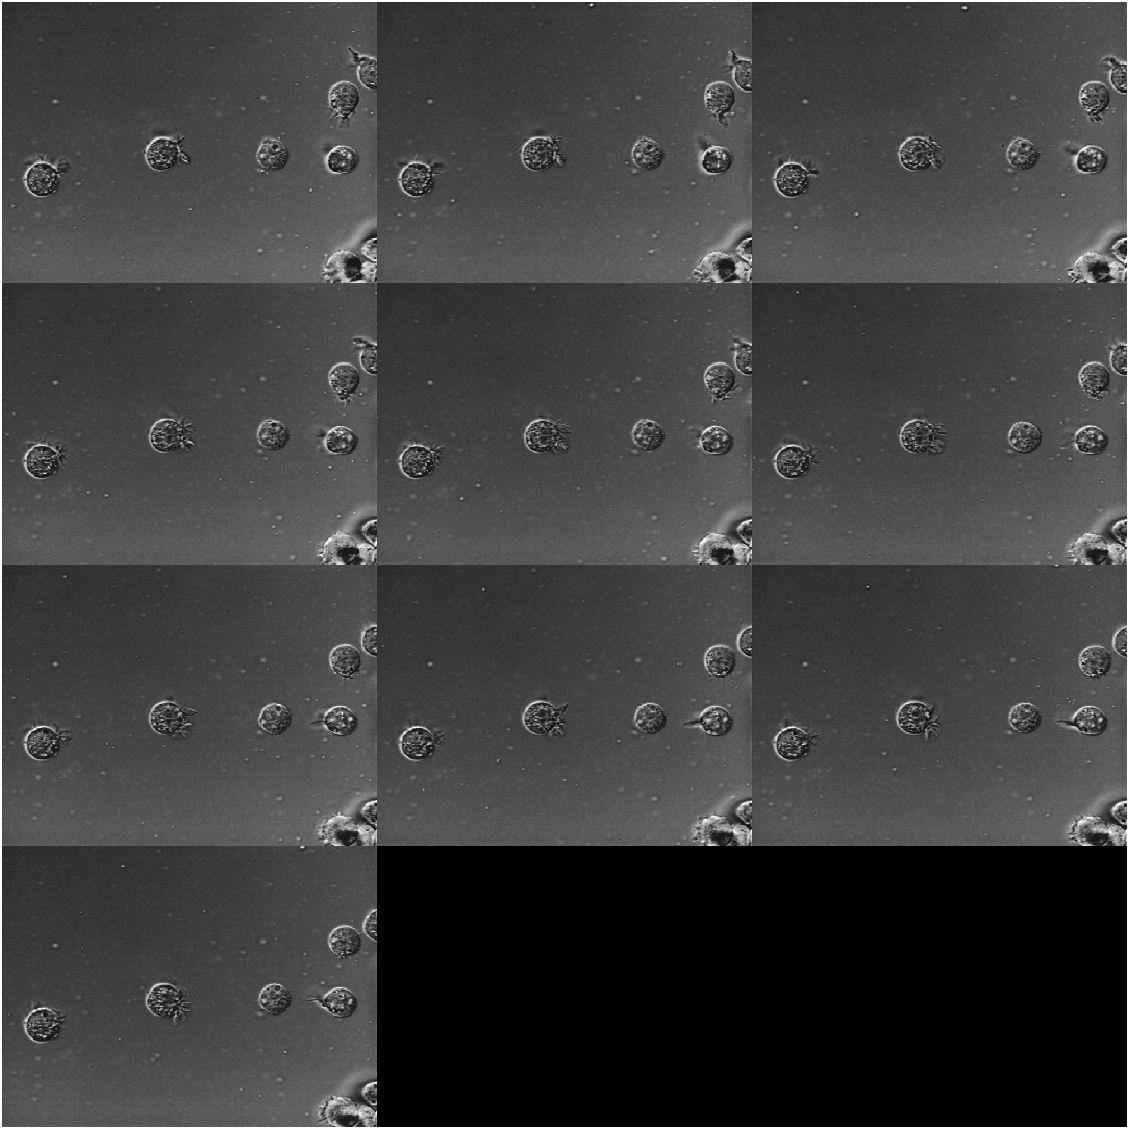
Example 4: create montage from image datastore
mongtage function is also available for ImageDatastore object, for example:
1
2
3
4
5
6
7
8
9
10
clc,clear,close all

% Create an ImageDatastore object containing a series of ten images from
% the Image Processing Toolbox™ sample image folder.
fileFolder = fullfile(matlabroot,"toolbox","images","imdata");
imds = imageDatastore(fullfile(fileFolder,"AT3*"));

% Display the contents of the datastore as a montage
figure("Color","w")
montage(imds)
where
1
2
3
4
>> whos
  Name            Size            Bytes  Class                                 Attributes
  fileFolder      1x1               246  string
  imds            1x1                 8  matlab.io.datastore.ImageDatastore
imageDatastore function is listed in the “MATLAB Data Import and Analysis” part, and used to “manage a collection of image files, where each individual image fits in memory, but the entire collection of images does not necessarily fit.”11 It frequently appears in the workflow of MATLAB deep learning related to images. Therefore, this feature of montage function makes it convenient to show the images managed by imageDatastore object, like in the target detection example Object Detection Using YOLO v3 Deep Learning12.
References
-
MATLAB
montage: Display multiple image frames as rectangular montage - MathWorks. ˄ ˄2 -
Zong, Chunyu, et al. “AC flashover characteristics and arc development process of glaze ice-covered insulators in natural environment.” International Journal of Electrical Power & Energy Systems 135 (2022): 107559, available at: AC flashover characteristics and arc development process of glaze ice-covered insulators in natural environment - ScienceDirect. ˄
-
Goodfellow, Ian, et al. “Generative adversarial nets.” Advances in neural information processing systems 27 (2014), available at: Generative Adversarial Nets. ˄
-
Train Wasserstein GAN with Gradient Penalty (WGAN-GP) - MathWorks. ˄
-
Train Generative Adversarial Network (GAN) in MATLAB - What a starry night~. ˄
-
Train Wassertein GAN with Gradient with Gradient Penalty (WGAN-GP) in MATLAB - What a starry night~. ˄
-
MATLAB
imtile: Combine multiple image frames into one rectangular tiled image - MathWorks. ˄ -
MATLAB
rescale: Scale range of array elements - MathWorks. ˄ -
MATLAB
imageDatastore: Datastore for image data - MathWorks. ˄