Force Floats Appear Where They Are Defined in LaTeX
LaTeX floats
In LaTeX, figures and tables that created by the figure and table environment are, by default, floats1, and LaTeX adopts different methods, or rather, algorithms, to determine the position of normal text and floats:
Floats are containers for things in a document that cannot be broken over a page. LaTeX by default recognizes “table” and “figure” floats, but you can define new ones of your own. Floats are there to deal with the problem of the object that won’t fit on the present page and to help when you really don’t want the object here just now.
Floats are not part of the normal stream of text, but separate entities, positioned in a part of the page to themselves (top, middle, bottom, left, right, or wherever the designer specifies). They always have a caption describing them and they are always numbered so they can be referred to from elsewhere in the text. LaTeX automatically floats Tables and Figures, depending on how much space is left on the page at the point that they are processed. If there is not enough room on the current page, the float is moved to the top of the next page. This can be changed by moving the Table or Figure definition to an earlier or later point in the text, or by adjusting some of the parameters which control automatic floating.
Authors sometimes have many floats occurring in rapid succession, which raises the problem of how they are supposed to fit on the page and still leave room for text. In this case, LaTeX stacks them all up and prints them together if possible, or leaves them to the end of the chapter in protest. The skill is to space them out within your text so that they intrude neither on the thread of your argument or discussion nor on the visual balance of the typeset pages.
For example, the figure environment will create a float figure:
1
2
3
\begin{figure}[placement specifier]
... figure contents ...
\end{figure}
where “The placement specifier parameter exists as a compromise, and its purpose is to give the author a greater degree of control over where certain floats are placed.”1:
Specifier and its Permission:
h: Place the float here, i.e., approximately at the same point it occurs in the source text (however, not exactly at the spot).t: Position at the top of the page.b: Position at the bottom of the page.p: Put on a special page for floats only.!: Override internal parameters LaTeX uses for determining “good” float positions.H: Places the float at precisely the location in the LaTeX code. Requires thefloatpackage, i.e.,\usepackage{float}.
Force floats appear where they are defined
Sometimes, people, myself included, want the floats appear where they are defined, i.e., the relation between main text and floats is the same in the LaTeX source code and correspondingly rendered document, or rather, make floats do not float. To this end, in addition to aforementioned placement specifiers, [h] and [H] (provided by the float package), there are also other ways1:
- The
placeinspackage provides the command\FloatBarrier, which can be used to prevent floats from being moved over it. This can, e.g., be useful at the beginning of each section. The package even provides an option to change the definition of\sectionto automatically include a\FloatBarrier. This can be set by loading the package with the option[section](\usepackage[section]{placeins}).\FloatBarriermay also be useful to prevent floats intruding on lists created usingitemizeorenumerate. - The
flafterpackage can be used to force floats to appear after they are defined, and theendfloatpackage can be used to place all floats at the end of a document. - The
floatpackage provides theHoption to floating environments, which completely stops them from floating. - Package
captionprovides the command\captionof{<type>}{<caption text>}that lets you typeset a caption without a floating environment. You have the full and absolute control about the placement of your figures and captions.
In the following text, I would compare these methods by taking an example.
Examples
The original case (default float)
1
2
3
4
5
6
7
8
9
10
11
12
13
14
15
16
17
18
19
20
21
22
23
24
25
26
27
28
29
30
31
32
33
34
35
36
37
38
39
40
41
42
43
44
45
46
47
48
49
50
51
52
53
54
55
56
57
58
59
60
61
62
63
64
65
66
67
68
69
70
71
72
73
74
75
76
77
78
79
80
81
82
83
84
85
86
87
88
89
90
91
92
93
94
95
96
97
98
99
100
101
102
103
104
105
106
107
108
109
110
111
112
113
114
115
116
117
118
\documentclass[a4paper]{article}
\usepackage[margin=1in]{geometry}
\usepackage{amsmath}
\usepackage[colorlinks, linkcolor=blue]{hyperref}
\usepackage[x11names]{xcolor}
\pagecolor{AntiqueWhite1}
\usepackage{graphicx,subfig}
\renewcommand{\figurename}{Fig.}
\numberwithin{equation}{section}
\numberwithin{figure}{section}
\def\CE{0.20}
\usepackage{lipsum}
\newcommand{\mylipsum}{\lipsum[1-3]}
\begin{document}
\section{Section 1}
\mylipsum
\begin{figure}
\centering
\subfloat[]{\includegraphics[height=\CE\textwidth,width=\CE\textwidth]{ctanlion.eps}}\hfill
\subfloat[]{\includegraphics[height=\CE\textwidth,width=\CE\textwidth]{ctanlion.eps}}\hfill
\subfloat[]{\includegraphics[height=\CE\textwidth,width=\CE\textwidth]{ctanlion.eps}}\hfill
\subfloat[]{\includegraphics[height=\CE\textwidth, width=\CE\textwidth]{ctanlion.eps}}
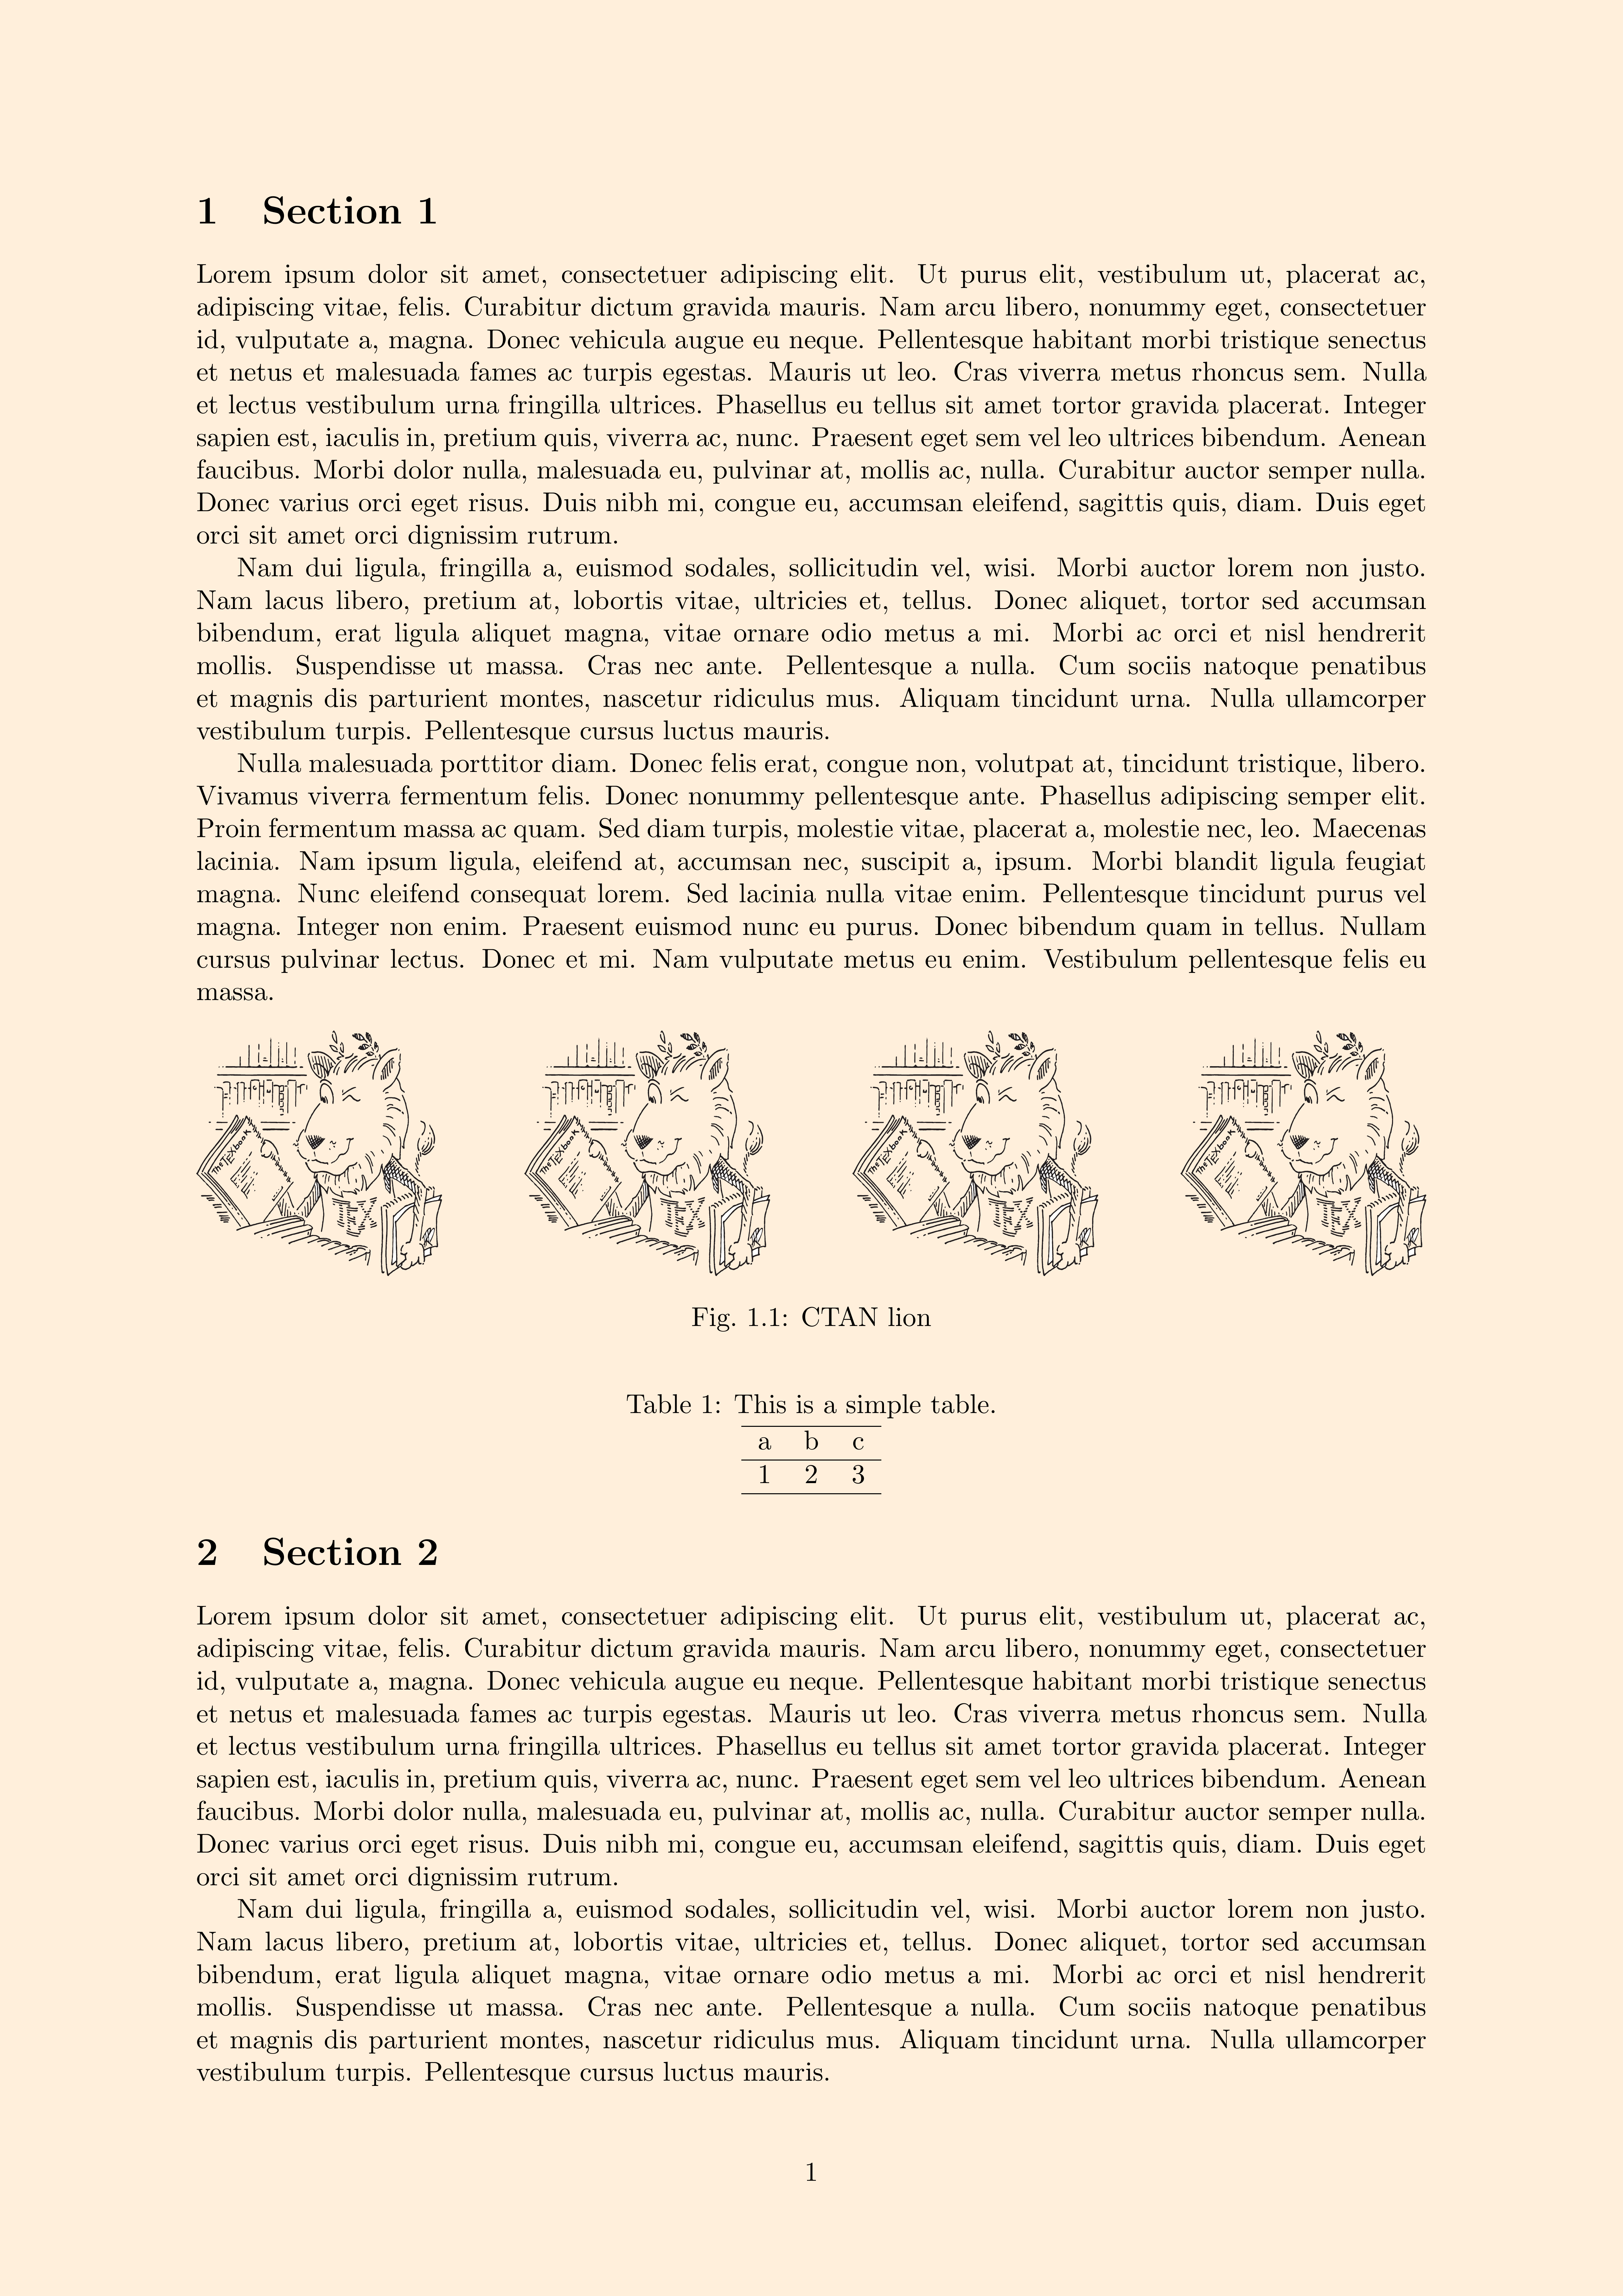
\caption{CTAN lion}
\label{fig-1}
\end{figure}
\begin{table}
\centering
\caption{This is a simple table.}
\begin{tabular}{ccc}
\hline
a & b & c\\ \hline
1 & 2 & 3\\ \hline
\end{tabular}
\end{table}
\section{Section 2}
\mylipsum
\subsection{Subsection 2.1}
\mylipsum
\begin{figure}
\centering
\subfloat[]{\includegraphics[height=\CE\textwidth,width=\CE\textwidth]{ctanlion.eps}}\hfill
\subfloat[]{\includegraphics[height=\CE\textwidth,width=\CE\textwidth]{ctanlion.eps}}\hfill
\subfloat[]{\includegraphics[height=\CE\textwidth,width=\CE\textwidth]{ctanlion.eps}}\hfill
\subfloat[]{\includegraphics[height=\CE\textwidth, width=\CE\textwidth]{ctanlion.eps}}
\caption{CTAN lion}
\label{fig-2}
\end{figure}
\begin{table}
\centering
\caption{This is a simple table.}
\begin{tabular}{ccc}
\hline
a & b & c\\ \hline
1 & 2 & 3\\ \hline
\end{tabular}
\end{table}
\subsection{Subsection 2.2}
\mylipsum
\begin{figure}
\centering
\subfloat[]{\includegraphics[height=\CE\textwidth,width=\CE\textwidth]{ctanlion.eps}}\hfill
\subfloat[]{\includegraphics[height=\CE\textwidth,width=\CE\textwidth]{ctanlion.eps}}\hfill
\subfloat[]{\includegraphics[height=\CE\textwidth,width=\CE\textwidth]{ctanlion.eps}}\hfill
\subfloat[]{\includegraphics[height=\CE\textwidth, width=\CE\textwidth]{ctanlion.eps}}
\caption{CTAN lion}
\label{fig-3}
\end{figure}
\begin{table}
\centering
\caption{This is a simple table.}
\begin{tabular}{ccc}
\hline
a & b & c\\ \hline
1 & 2 & 3\\ \hline
\end{tabular}
\end{table}
\section{Section 3}
\mylipsum
\section{Section 4}
\mylipsum
\begin{figure}
\centering
\subfloat[]{\includegraphics[height=\CE\textwidth,width=\CE\textwidth]{ctanlion.eps}}\hfill
\subfloat[]{\includegraphics[height=\CE\textwidth,width=\CE\textwidth]{ctanlion.eps}}\hfill
\subfloat[]{\includegraphics[height=\CE\textwidth,width=\CE\textwidth]{ctanlion.eps}}\hfill
\subfloat[]{\includegraphics[height=\CE\textwidth, width=\CE\textwidth]{ctanlion.eps}}
\caption{CTAN lion}
\label{fig-4}
\end{figure}
\begin{table}
\centering
\caption{This is a simple table.}
\begin{tabular}{ccc}
\hline
a & b & c\\ \hline
1 & 2 & 3\\ \hline
\end{tabular}
\end{table}
\end{document}

In the source code, I add a figure and a table below Section 1, Subsection 2.1, Subsection 2.2, and Section 4, respectively. However, as can be seen in the rendered document, if without any placement specifier (i.e., the default case), floats will be placed at the top of each page (however, this doesn’t means that floats are always moved to the top of the page).
Use placement specifiers
Placement specifier [h]
Add the placement specifier [h] after each float environment in the Script 1, for example:
1
2
3
4
5
6
7
8
9
10
11
12
13
14
15
16
17
18
19
20
21
22
23
% ...

\begin{figure}[h]
\centering
\subfloat[]{\includegraphics[height=\CE\textwidth,width=\CE\textwidth]{ctanlion.eps}}\hfill
\subfloat[]{\includegraphics[height=\CE\textwidth,width=\CE\textwidth]{ctanlion.eps}}\hfill
\subfloat[]{\includegraphics[height=\CE\textwidth,width=\CE\textwidth]{ctanlion.eps}}\hfill
\subfloat[]{\includegraphics[height=\CE\textwidth, width=\CE\textwidth]{ctanlion.eps}}
\caption{CTAN lion}
\label{fig-1}
\end{figure}

\begin{table}[h]
\centering
\caption{This is a simple table.}
\begin{tabular}{ccc}
\hline
a & b & c\\ \hline
1 & 2 & 3\\ \hline
\end{tabular}
\end{table}

% ...

At this time, with the [h] option, figures and tables indeed appear where they are defined.
Placement specifier [!h]
Add the placement specifier [!h] after each float in the Script 1:


For this example, using the placement specifier [!h] has the same effect as using [h].
Placement specifier [H] (provided by the float package)
Import the float package, \usepackage{float}, in the preamble, and add the placement specifier [H] after each float in the Script 1:
In this example, using [H] option of the float package also has the same effect as using the [h] option.
The placeins package
Use the \FloatBarrier command
Import the placeins package, and use a \FloatBarrier command after every \section and \subsection command based on the Script 1:
1
2
3
4
5
6
7
8
9
10
11
12
13
14
15
16
17
18
19
20
21
22
23
24
25
26
27
28
29
30
31
32
33
34
35
36
37
38
39
40
41
42
43
44
45
46
47
48
49
50
51
52
53
54
55
56
57
58
59
60
61
62
63
64
65
66
67
68
69
70
71
72
73
74
75
76
77
78
79
80
81
82
83
84
85
86
87
88
89
90
91
92
93
94
95
96
97
98
99
100
101
102
103
104
105
106
107
108
109
110
111
112
113
114
115
116
117
118
119
120
121
122
123
124
125
126
\documentclass[a4paper]{article}
\usepackage[margin=1in]{geometry}
\usepackage{amsmath}
\usepackage[colorlinks, linkcolor=blue]{hyperref}
\usepackage[x11names]{xcolor}
\pagecolor{AntiqueWhite1}
\usepackage{graphicx,subfig}
\renewcommand{\figurename}{Fig.}

\numberwithin{equation}{section}
\numberwithin{figure}{section}

\def\CE{0.20}

\usepackage{lipsum}
\newcommand{\mylipsum}{\lipsum[1-3]}

\usepackage{placeins}

\begin{document}

\section{Section 1}
\FloatBarrier
\mylipsum

\begin{figure}
\centering
\subfloat[]{\includegraphics[height=\CE\textwidth,width=\CE\textwidth]{ctanlion.eps}}\hfill
\subfloat[]{\includegraphics[height=\CE\textwidth,width=\CE\textwidth]{ctanlion.eps}}\hfill
\subfloat[]{\includegraphics[height=\CE\textwidth,width=\CE\textwidth]{ctanlion.eps}}\hfill
\subfloat[]{\includegraphics[height=\CE\textwidth, width=\CE\textwidth]{ctanlion.eps}}
\caption{CTAN lion}
\label{fig-1}
\end{figure}

\begin{table}
\centering
\caption{This is a simple table.}
\begin{tabular}{ccc}
\hline
a & b & c\\ \hline
1 & 2 & 3\\ \hline
\end{tabular}
\end{table}

\section{Section 2}
\FloatBarrier
\mylipsum

\subsection{Subsection 2.1}
\FloatBarrier
\mylipsum

\begin{figure}
\centering
\subfloat[]{\includegraphics[height=\CE\textwidth,width=\CE\textwidth]{ctanlion.eps}}\hfill
\subfloat[]{\includegraphics[height=\CE\textwidth,width=\CE\textwidth]{ctanlion.eps}}\hfill
\subfloat[]{\includegraphics[height=\CE\textwidth,width=\CE\textwidth]{ctanlion.eps}}\hfill
\subfloat[]{\includegraphics[height=\CE\textwidth, width=\CE\textwidth]{ctanlion.eps}}
\caption{CTAN lion}
\label{fig-2}
\end{figure}

\begin{table}
\centering
\caption{This is a simple table.}
\begin{tabular}{ccc}
\hline
a & b & c\\ \hline
1 & 2 & 3\\ \hline
\end{tabular}
\end{table}

\subsection{Subsection 2.2}
\FloatBarrier
\mylipsum

\begin{figure}
\centering
\subfloat[]{\includegraphics[height=\CE\textwidth,width=\CE\textwidth]{ctanlion.eps}}\hfill
\subfloat[]{\includegraphics[height=\CE\textwidth,width=\CE\textwidth]{ctanlion.eps}}\hfill
\subfloat[]{\includegraphics[height=\CE\textwidth,width=\CE\textwidth]{ctanlion.eps}}\hfill
\subfloat[]{\includegraphics[height=\CE\textwidth, width=\CE\textwidth]{ctanlion.eps}}
\caption{CTAN lion}
\label{fig-3}
\end{figure}

\begin{table}
\centering
\caption{This is a simple table.}
\begin{tabular}{ccc}
\hline
a & b & c\\ \hline
1 & 2 & 3\\ \hline
\end{tabular}
\end{table}

\section{Section 3}
\FloatBarrier
\mylipsum

\section{Section 4}
\FloatBarrier
\mylipsum

\begin{figure}
\centering
\subfloat[]{\includegraphics[height=\CE\textwidth,width=\CE\textwidth]{ctanlion.eps}}\hfill
\subfloat[]{\includegraphics[height=\CE\textwidth,width=\CE\textwidth]{ctanlion.eps}}\hfill
\subfloat[]{\includegraphics[height=\CE\textwidth,width=\CE\textwidth]{ctanlion.eps}}\hfill
\subfloat[]{\includegraphics[height=\CE\textwidth, width=\CE\textwidth]{ctanlion.eps}}
\caption{CTAN lion}
\label{fig-4}
\end{figure}

\begin{table}
\centering
\caption{This is a simple table.}
\begin{tabular}{ccc}
\hline
a & b & c\\ \hline
1 & 2 & 3\\ \hline
\end{tabular}
\end{table}

\end{document}


Import the package with the section option
Do not use the \FloatBarrier command each time, but instead add \usepackage[section]{placeins} in the preamble based on the Script 1:

Summary
Above two ways of using the placeins package have the same effect, at least for this example. They really prevent floats from being moved over where the \FloatBarrier command is used, but it’s different from forcing floats fix where they are defined. Also, the overall layout is not good, even worse. Besides, there is a bug of the placeins package23.
The flafter package (vs. the endfloat package)
Just use \usepackage{flafter} in the preamble based on the Script 1:

As can be seen, the flafter package can “force floats to appear after they are defined”, but similar to the placeins package, it can’t force them appear where they are defined. Besides, there are some unexpected additional blank spaces before the last figure and the last table.
As a comparison, we can use the endfloat package instead in the preamble, then we have:


Not use figure and table environment
Actually, the fact that the figures and tables are float is determined by the figure and table environment. So, if we don’t use these two environments, then figures and tables won’t float. For example, we can use \includegraphics commands and tabular environments in the center environment, rather than figure and table environment, to show figures and tables, and then use the \captionof command of the caption package to add captions for them:
1
2
3
4
5
6
7
8
9
10
11
12
13
14
15
16
17
18
19
20
21
22
23
24
25
26
27
28
29
30
31
32
33
34
35
36
37
38
39
40
41
42
43
44
45
46
47
48
49
50
51
52
53
54
55
56
57
58
59
60
61
62
63
64
65
66
67
68
69
70
71
72
73
74
75
76
77
78
79
80
81
82
83
84
85
86
87
88
89
90
91
92
93
94
95
96
97
98
99
100
101
102
103
104
105
106
107
108
109
110
111
112
113
114
115
\documentclass[a4paper]{article}
\usepackage[margin=1in]{geometry}
\usepackage{amsmath}
\usepackage[colorlinks, linkcolor=blue]{hyperref}
\usepackage[x11names]{xcolor}
\pagecolor{AntiqueWhite1}
\usepackage{graphicx}
\renewcommand{\figurename}{Fig.}

\numberwithin{equation}{section}
\numberwithin{figure}{section}

\def\CE{0.20}

\usepackage{lipsum}
\newcommand{\mylipsum}{\lipsum[1-3]}

\usepackage{caption}

\begin{document}

\section{Section 1}
\mylipsum

\begin{center}
\includegraphics[height=\CE\textwidth,width=\CE\textwidth]{ctanlion.eps}\hfill
\includegraphics[height=\CE\textwidth,width=\CE\textwidth]{ctanlion.eps}\hfill
\includegraphics[height=\CE\textwidth,width=\CE\textwidth]{ctanlion.eps}\hfill
\includegraphics[height=\CE\textwidth, width=\CE\textwidth]{ctanlion.eps}
\captionof{figure}{CTAN lion}
\label{fig-1}
\end{center}

\begin{center}
\captionof{table}{This is a simple table.}
\begin{tabular}{ccc}
\hline
a & b & c\\ \hline
1 & 2 & 3\\ \hline
\end{tabular}
\end{center}

\section{Section 2}
\mylipsum

\subsection{Subsection 2.1}
\mylipsum

\begin{center}
\includegraphics[height=\CE\textwidth,width=\CE\textwidth]{ctanlion.eps}\hfill
\includegraphics[height=\CE\textwidth,width=\CE\textwidth]{ctanlion.eps}\hfill
\includegraphics[height=\CE\textwidth,width=\CE\textwidth]{ctanlion.eps}\hfill
\includegraphics[height=\CE\textwidth, width=\CE\textwidth]{ctanlion.eps}
\captionof{figure}{CTAN lion}
\label{fig-2}
\end{center}

\begin{center}
\centering
\captionof{table}{This is a simple table.}
\begin{tabular}{ccc}
\hline
a & b & c\\ \hline
1 & 2 & 3\\ \hline
\end{tabular}
\end{center}

\subsection{Subsection 2.2}
\mylipsum

\begin{center}
\includegraphics[height=\CE\textwidth,width=\CE\textwidth]{ctanlion.eps}\hfill
\includegraphics[height=\CE\textwidth,width=\CE\textwidth]{ctanlion.eps}\hfill
\includegraphics[height=\CE\textwidth,width=\CE\textwidth]{ctanlion.eps}\hfill
\includegraphics[height=\CE\textwidth, width=\CE\textwidth]{ctanlion.eps}
\captionof{figure}{CTAN lion}
\label{fig-3}
\end{center}

\begin{center}
\centering
\captionof{table}{This is a simple table.}
\begin{tabular}{ccc}
\hline
a & b & c\\ \hline
1 & 2 & 3\\ \hline
\end{tabular}
\end{center}

\section{Section 3}
\mylipsum

\section{Section 4}
\mylipsum

\begin{center}
\includegraphics[height=\CE\textwidth,width=\CE\textwidth]{ctanlion.eps}\hfill
\includegraphics[height=\CE\textwidth,width=\CE\textwidth]{ctanlion.eps}\hfill
\includegraphics[height=\CE\textwidth,width=\CE\textwidth]{ctanlion.eps}\hfill
\includegraphics[height=\CE\textwidth, width=\CE\textwidth]{ctanlion.eps}
\captionof{figure}{CTAN lion}
\label{fig-4}
\end{center}

\begin{center}
\centering
\captionof{table}{This is a simple table.}
\begin{tabular}{ccc}
\hline
a & b & c\\ \hline
1 & 2 & 3\\ \hline
\end{tabular}
\end{center}

\end{document}
The results are really what we expect. One shortcoming is that, however, for figures, due to that we don’t use figure environment at this time, \subfloat can’t be used either. So, right now I don’t find a proper way to add a subcaption for each subfigure.
Discussions
From above examples, we can conclude that, to force floats appear where they are defined, the best way is to use option [h], [!h], or [H]. Of course, not using float environments is also available, but it’s a method not that standard.
However, it should be noted that, based on my experiences, using [H] option sometimes brings some additional blank spaces, even a whole blank page in some cases, after a float. To take a step further, there are more unexpected problems.
When we say “force floats appear where they are defined”, what we actually mean is to “force floats appear exactly where they are defined”, just as in Microsoft Word, figures will be at where they are inserted. In above examples, using placement specifier [h], [!h], or [H] can realize this point, but these options can’t always guarantee (as said before, these placement specifiers exist, to some extent, just as a compromise) — from time to time we can see that they seem not functional — because there actually are many rules, or rather, algorithms, to determine the final position of a float4, such as a basic one:
In fact this is a very professional field.
So, to my mind, in practice, we should try different ways or combine some of them to control the position of a float to reach a good effect. It depends. In some cases, it’s not a good choice to make every float appear where they are defined in the source code.
References