Specify Font Style in the Figures when Plotting by Python Matplotlib Package
Introduction
When making scientific drawings using Python Matplotlib package, there are two ways to change font styles: GLOBALLY specify a uniform font style for every text in figures, or LOCALLY specify font style for each text through specific property of functions. No matter adopt which method, some details should be noted. Therefore, by taking an official example Bar color demo1, I would try and learn both ways and take some notes about them in this post.
Specify font style GLOBALL
Runtime rc settings: matplotlib.rcParams function
First, we can use matplotlib.rcParams function to set font style by setting those parameters related to font, making the appearance of all texts in the figure the same. For instance, if we want to make text italic, bold, font size 22, and set font typeface as Times New Roman, we can realize it by:
1
2
3
4
5
6
7
8
9
10
11
12
13
14
15
16
17
18
19
20
21
22
23
24
25
26
27
import matplotlib.pyplot as plt
import matplotlib as mpl

# Change font typeface and font size globally
mpl.rcParams["font.family"] = "Times New Roman"
mpl.rcParams["font.style"] = "italic"
mpl.rcParams["font.weight"] = "bold"
mpl.rcParams["font.size"] = 22

fig, ax = plt.subplots()

fruits = ['apple', 'blueberry', 'cherry', 'orange']
counts = [40, 100, 30, 55]
bar_labels = ['red', 'blue', '_red', 'orange']
bar_colors = ['tab:red', 'tab:blue', 'tab:red', 'tab:orange']

ax.bar(fruits, counts, label=bar_labels, color=bar_colors)

ax.set_ylabel('fruit supply')
ax.set_title('Fruit supply by kind and color')
ax.legend(title='Fruit color')

# Save the figure
plt.savefig("fig.png", dpi=600)

# Show the figure
plt.show()
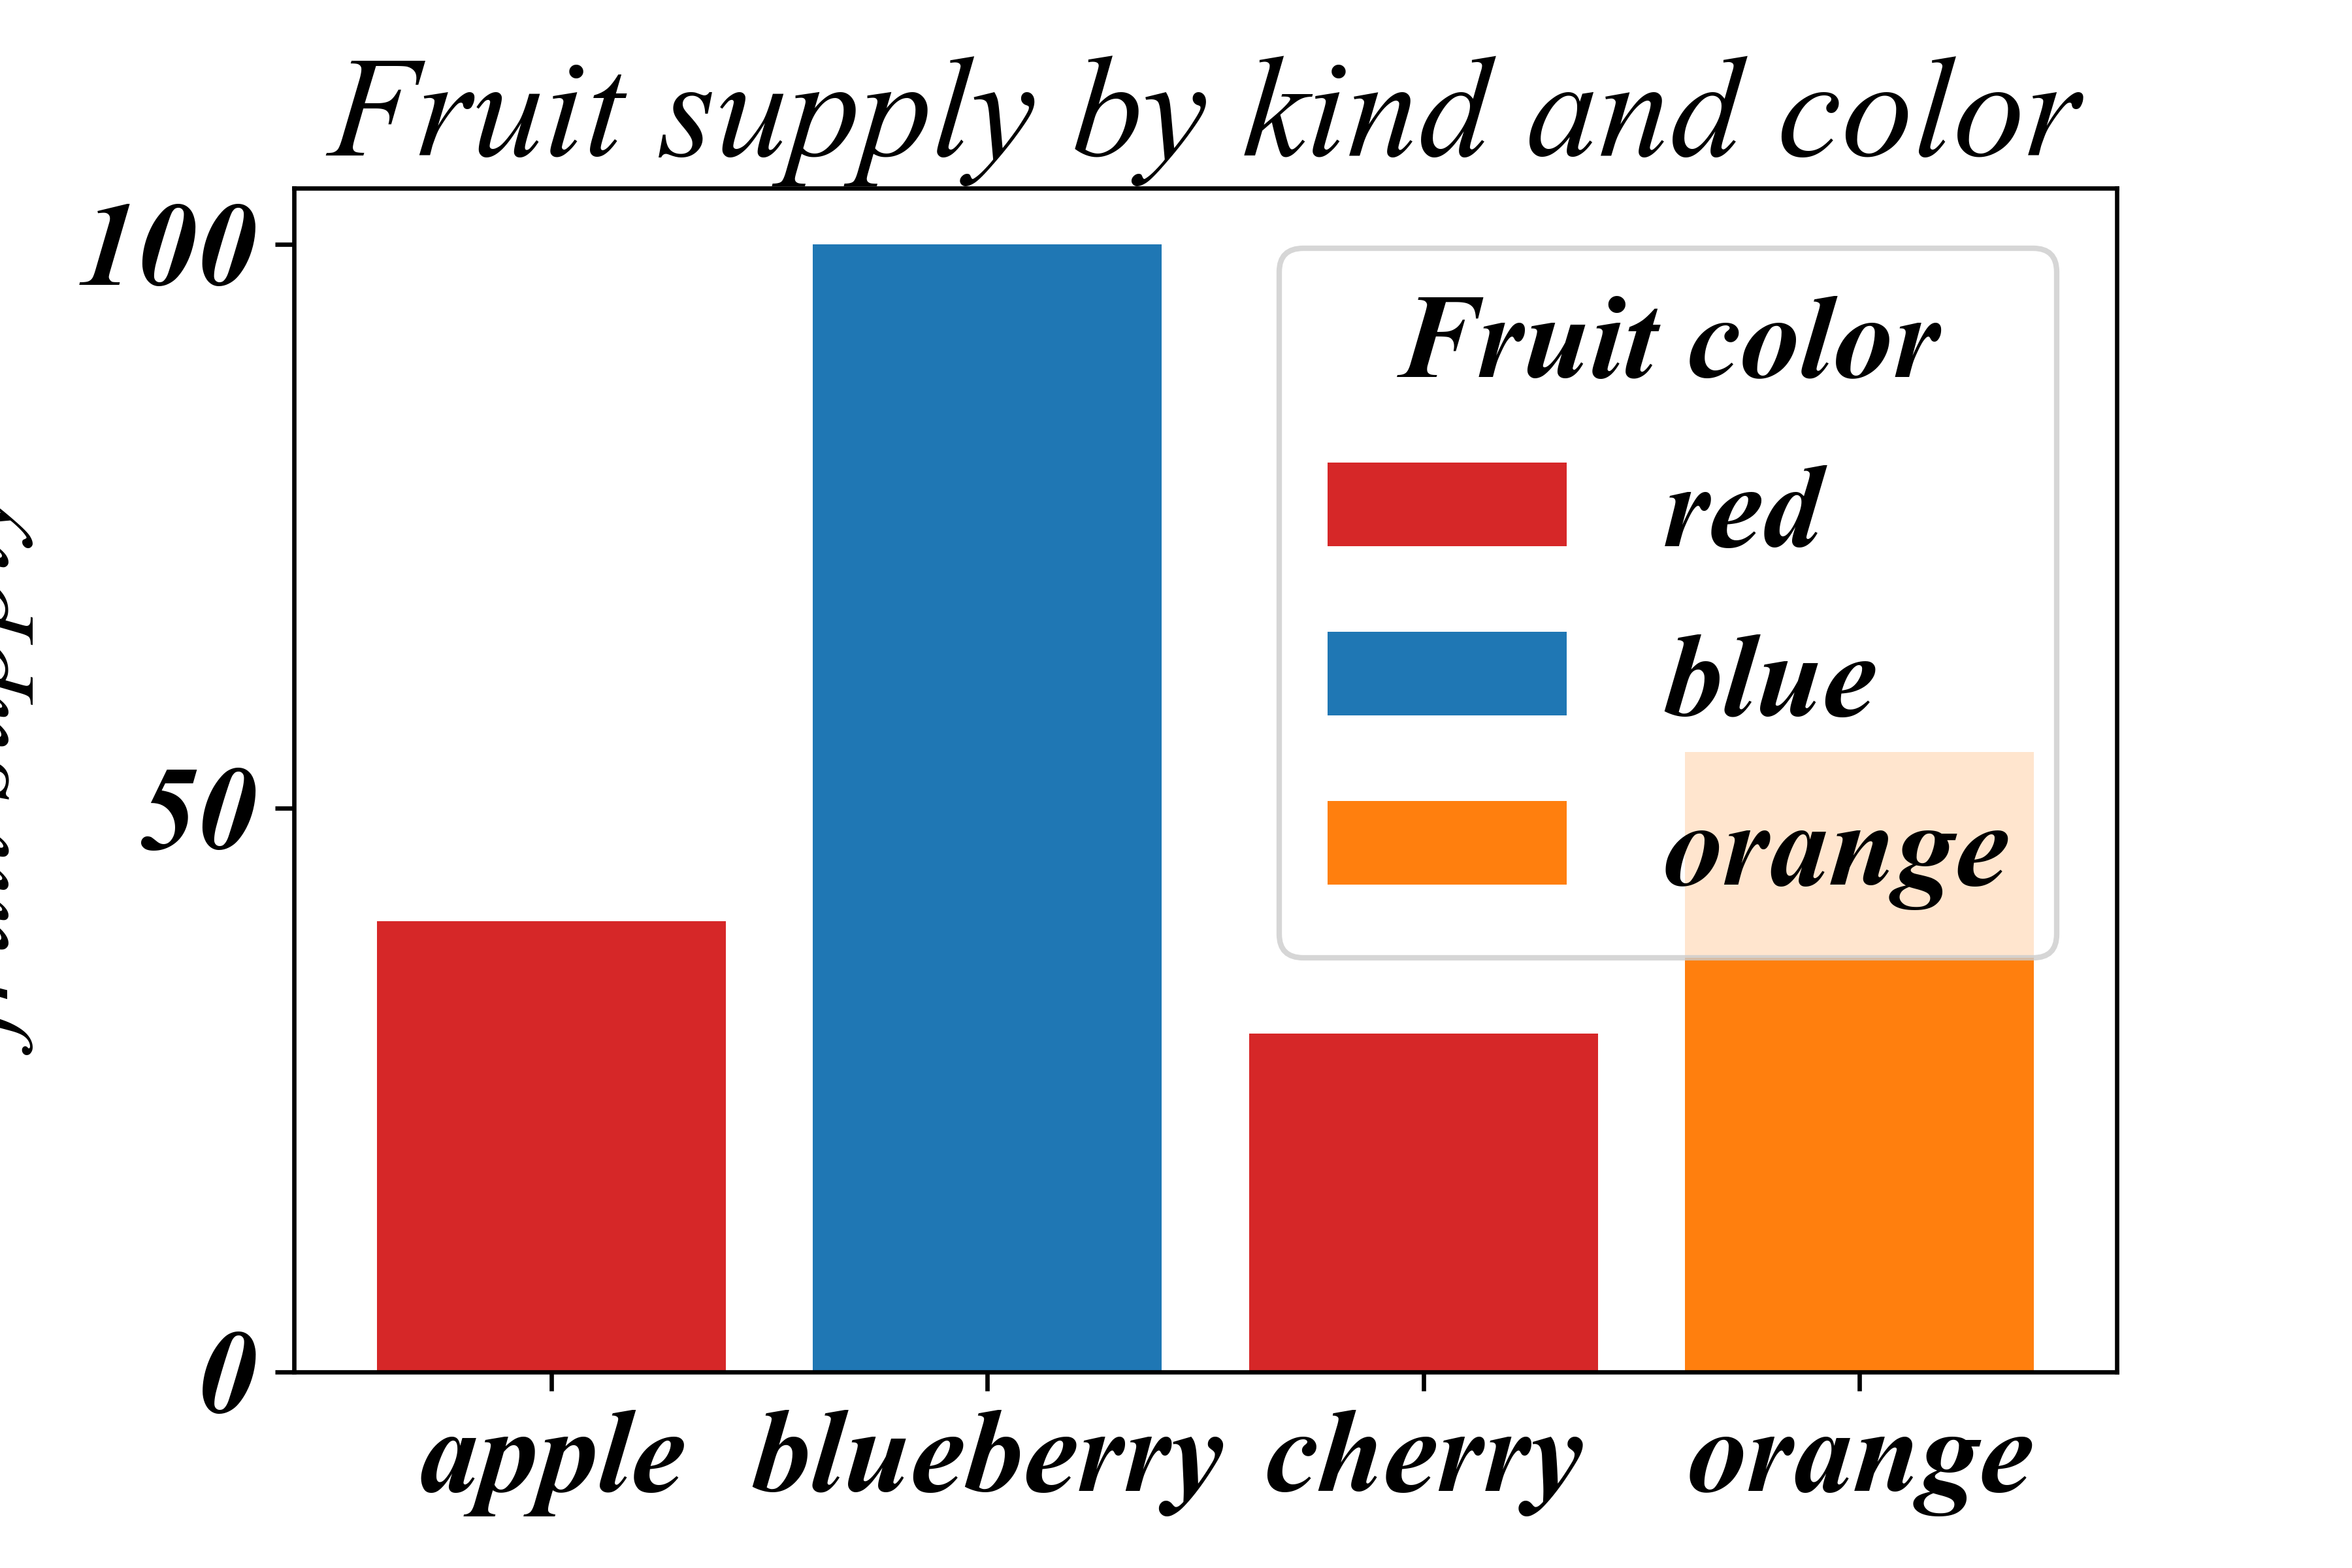
As can be seen, in Fig. 1, when we export graphics using pyplot.savefig function, y-label exceeds the left boundary of the figure to be exported. It is related to large font size, which means that the graphic-exported settings cannot be well adjusted as font size setting changes.
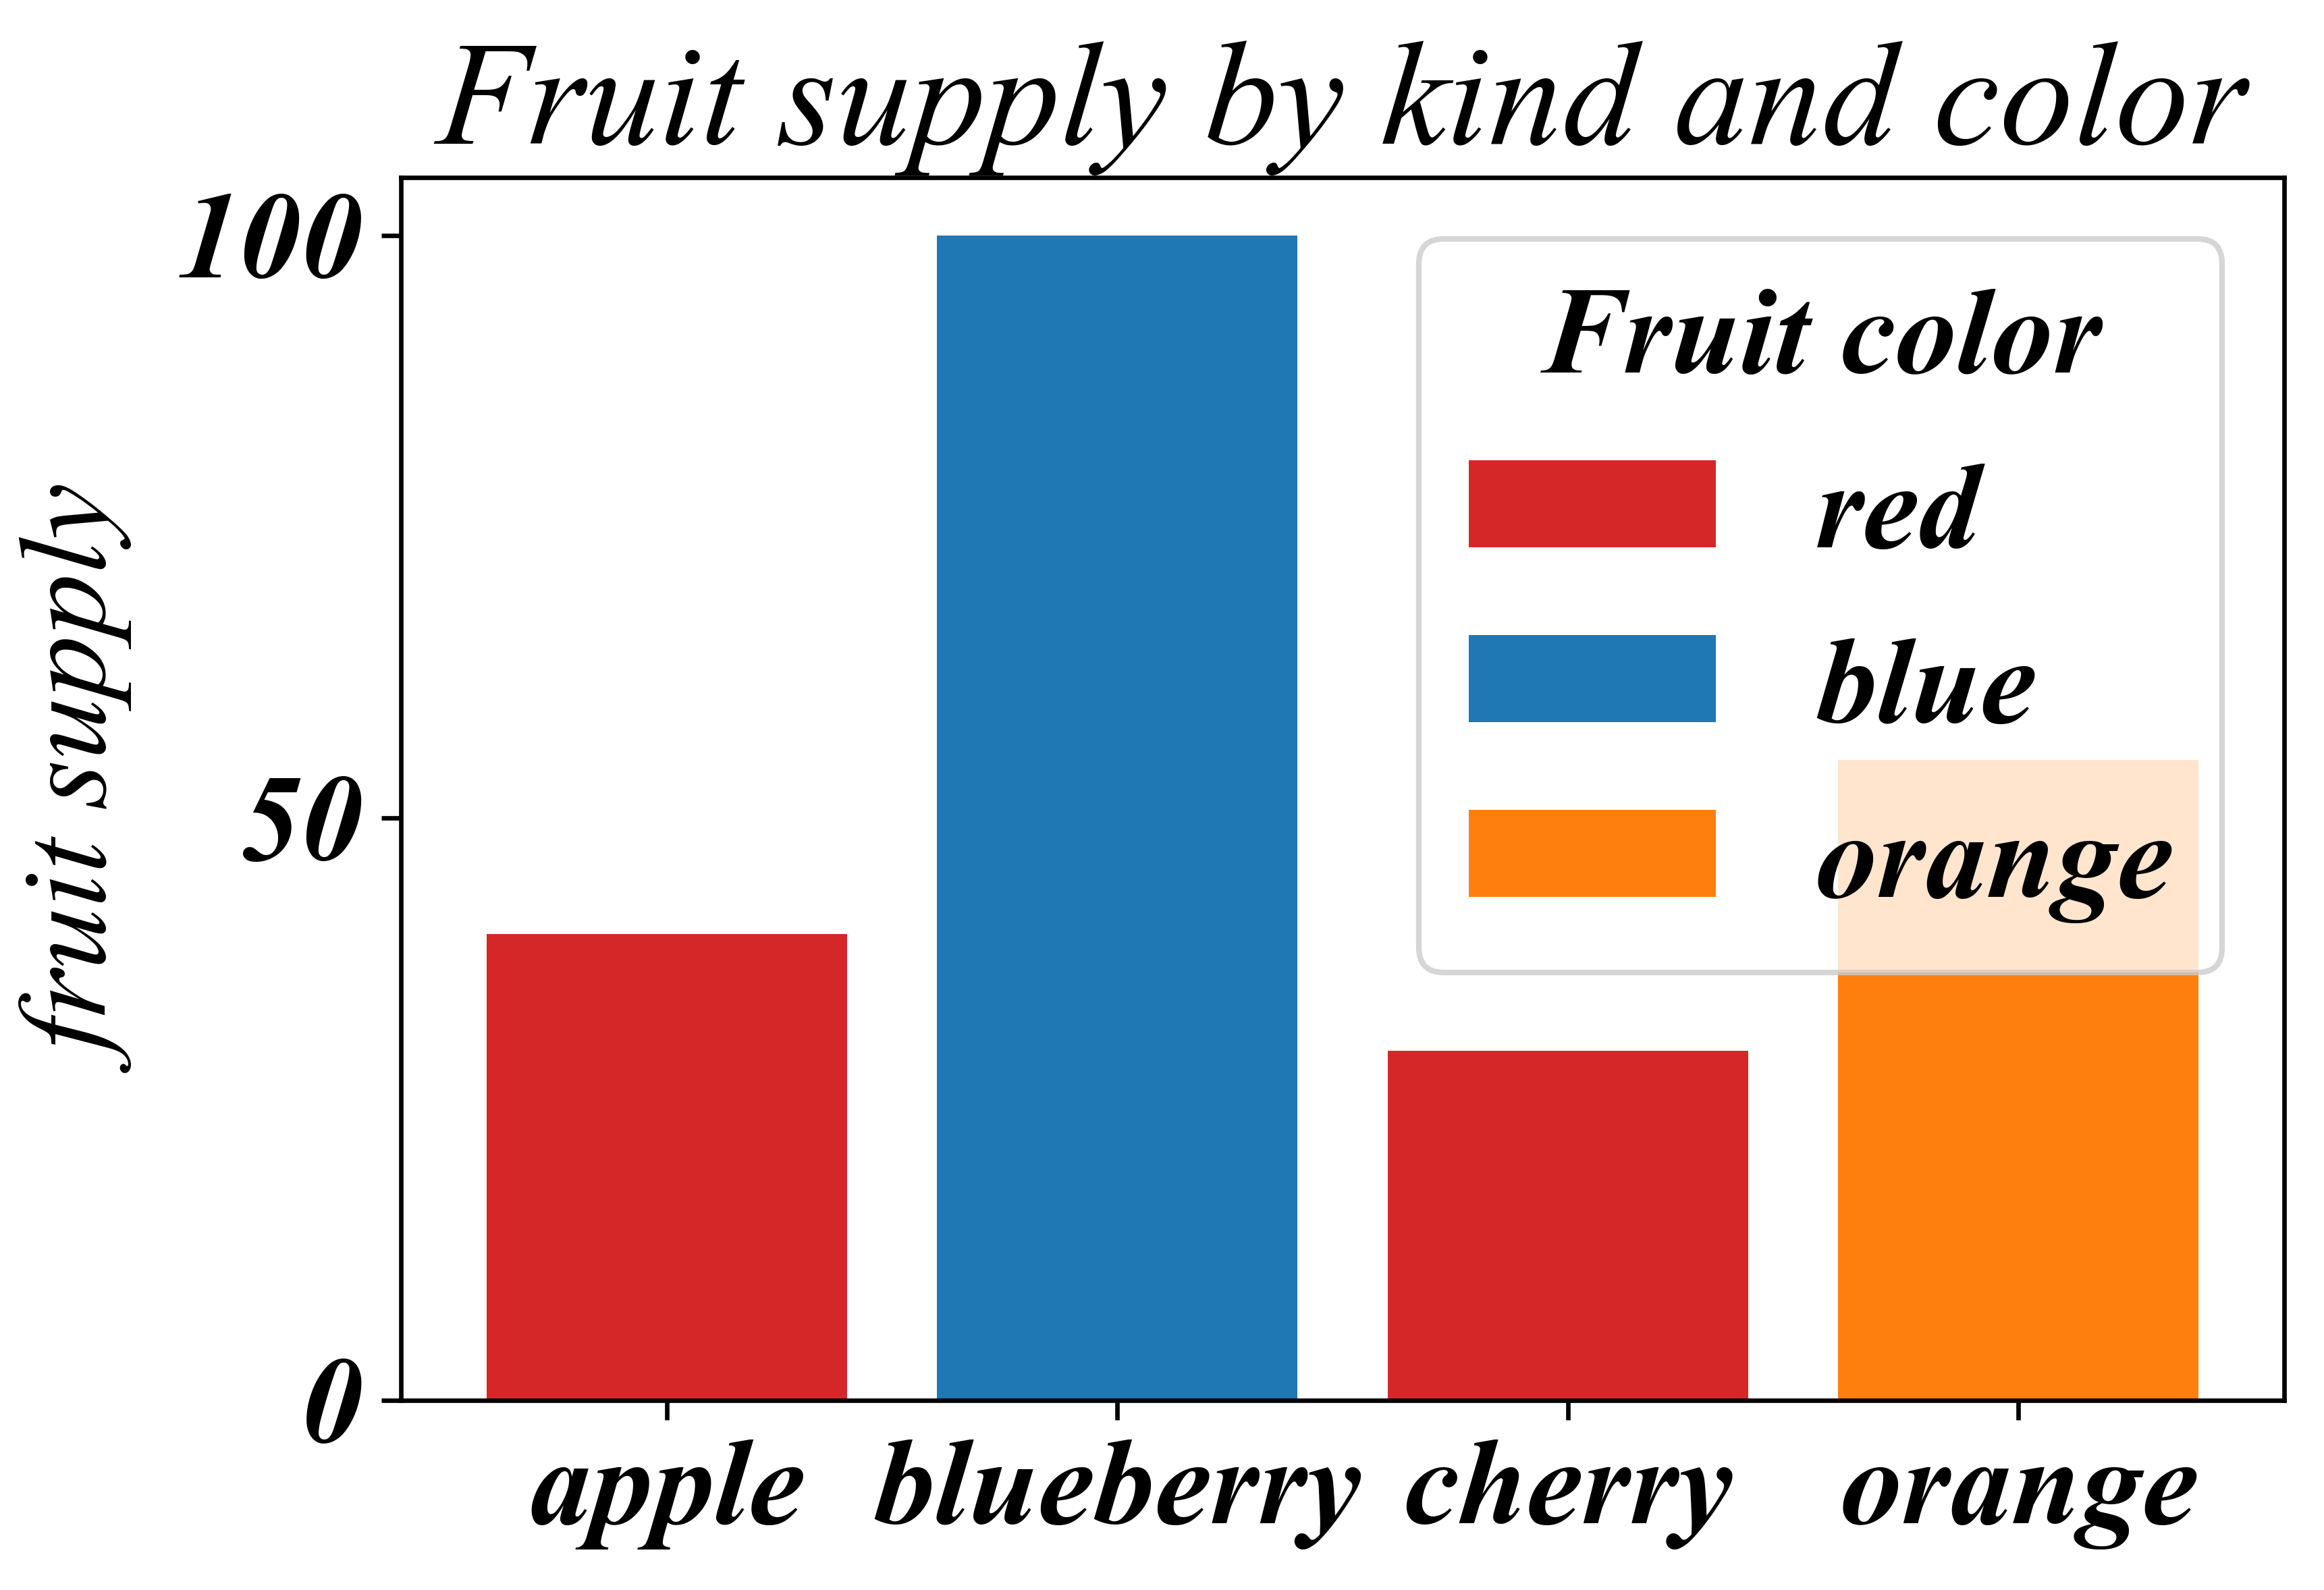
To solve this problem, we can set bbox_inches property of pyplot.savefig to 'tight'2:
1
2
3
4
5
6
# ...

# Save the figure
plt.savefig("fig.png",dpi=600,bbox_inches='tight')

# ...

According to Matplotlib documentation3, the default value of bbox_inches property is "None", meaning “only the given portion of the figure is saved”, and value "tight" means that “try to figure out the tight bbox of the figure.”
On another aspect, as shown in Fig. 1 and Fig. 2, specifying plt.rcParams["font.weight"] = "bold" isn’t functional for y-label and text. I have no idea about why right now.
Although Script 1 and Script 2 work well, there is one point should be noted. If we comment the font setting code like this:
1
2
3
4
5
6
7
8
9
10
11
12
13
14
15
16
17
18
19
20
21
22
23
24
25
26
27
28
29
import matplotlib.pyplot as plt
import matplotlib as mpl

# =============================================================================
# # Change font typeface and font size globally
# mpl.rcParams["font.family"] = "Times New Roman"
# mpl.rcParams["font.style"] = "italic"
# mpl.rcParams["font.weight"] = "bold"
# mpl.rcParams["font.size"] = 22
#
# =============================================================================
fig, ax = plt.subplots()

fruits = ['apple', 'blueberry', 'cherry', 'orange']
counts = [40, 100, 30, 55]
bar_labels = ['red', 'blue', '_red', 'orange']
bar_colors = ['tab:red', 'tab:blue', 'tab:red', 'tab:orange']

ax.bar(fruits, counts, label=bar_labels, color=bar_colors)

ax.set_ylabel('fruit supply')
ax.set_title('Fruit supply by kind and color')
ax.legend(title='Fruit color')

# Save the figure
plt.savefig("fig.png", dpi=600)

# Show the figure
plt.show()
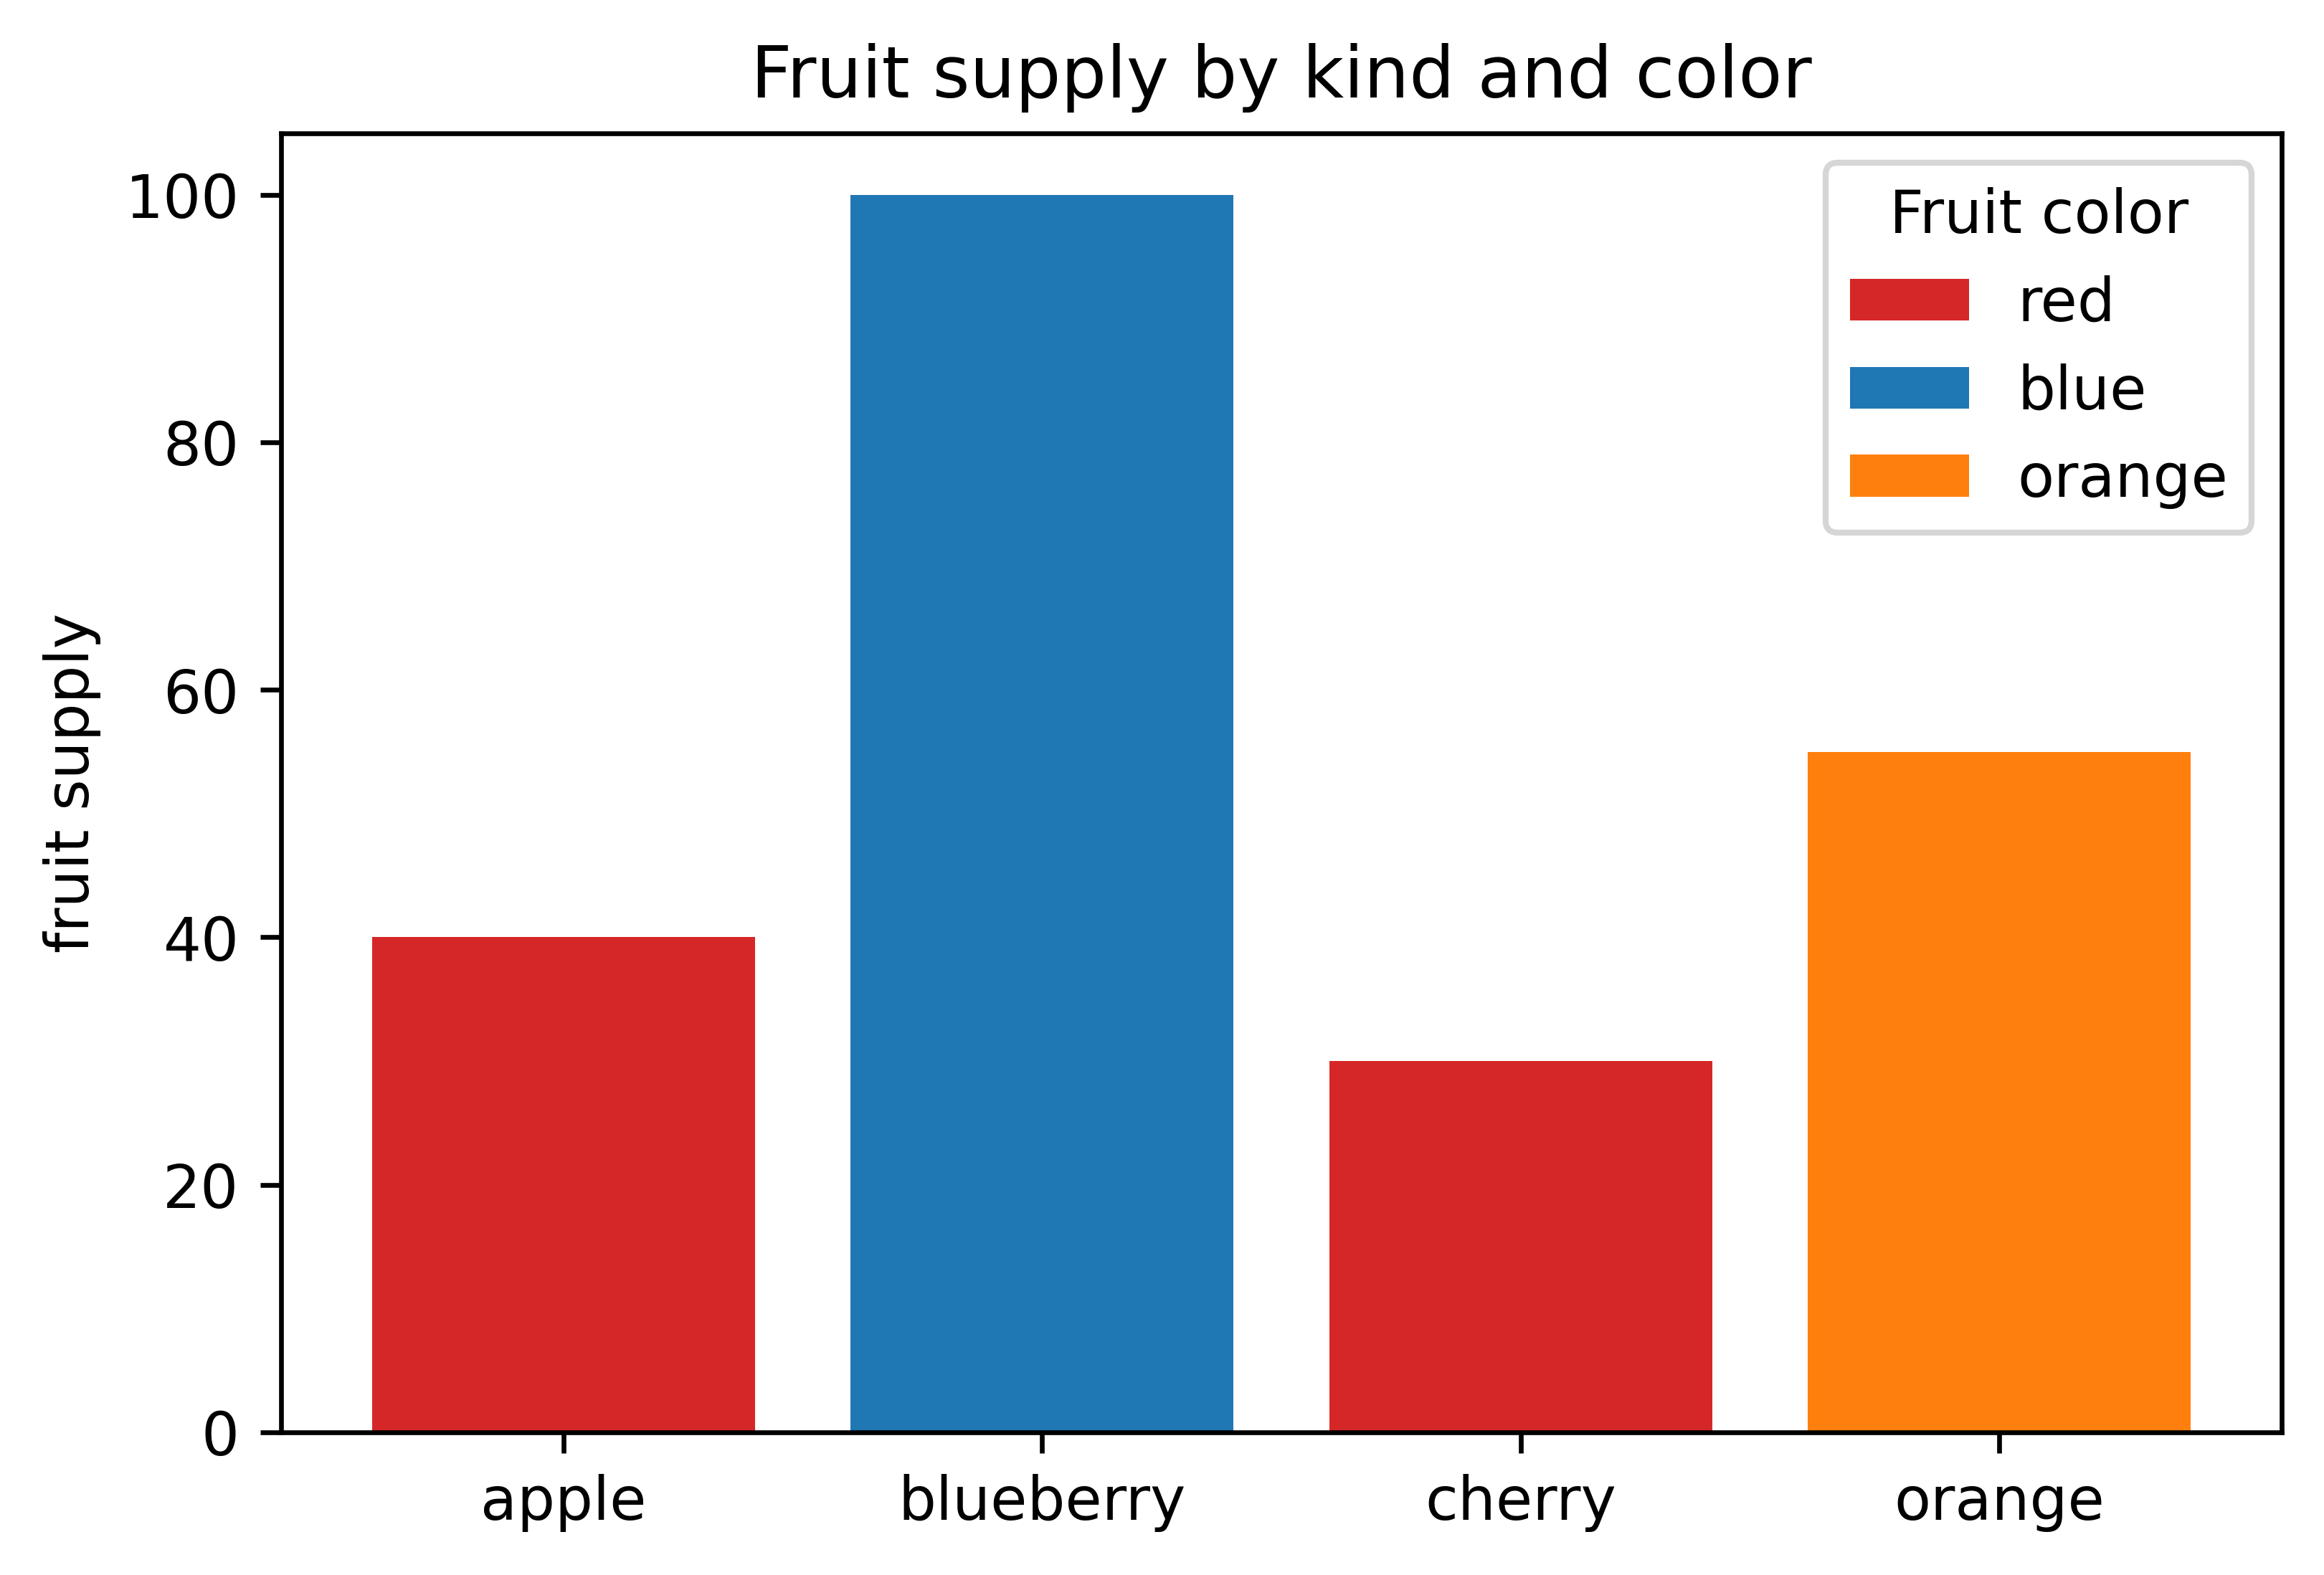
and run the script, the rendered image looks unchanged:

that is those font settings won’t be automatically changed back to default values, and we must restart Spyder IDE to restore to default settings. This point is very different from the way of global settings in MATLAB.
Apart from restarting IDE, we can add code mpl.style.use("default")45 at the beginning of the script, to explicitly restore to default style settings before every time executing the script:
1
2
3
4
5
6
7
8
9
10
11
12
13
14
15
import matplotlib.pyplot as plt
import matplotlib as mpl

# Restore to default style settings
mpl.style.use("default")

# Change font typeface and font size globally
mpl.rcParams["font.family"] = "Times New Roman"
mpl.rcParams["font.style"] = "italic"
mpl.rcParams["font.weight"] = "bold"
mpl.rcParams["font.size"] = 22

fig, ax = plt.subplots()

# ...
At this time, if we comment those font settings, a figure with default style will be rendered.
About this feature, Matplotlib documentation6 calls this setting method (i.e., use matplotlib.rcParams function) as “Runtime rc (runtime configuration) settings”, and by using it, “All rc settings are stored in a dictionary-like variable called matplotlib.rcParams, which is global to the matplotlib package.”
Versus “Runtime rc settings”, there is “Temporary rc settings”7 to temporarily change rcParams, which shows as follows.
Temporary rc settings: matplotlib.rc_context function
As described in the Matplotlib documentation7, “The matplotlib.rcParams object can also be changed temporarily using the matplotlib.rc_context context manager.”, and in which matplotlib.rc_context function can8:
Return a context manager for temporarily changing rcParams.
The rcParams["backend"] will not be reset by the context manager.
rcParams changed both through the context manager invocation and in the body of the context will be reset on context exit.
The documentation also provides two methods to use matplotlib.rc_context function7.
Method 1: using Python with statement
1
2
3
4
5
6
7
8
9
10
11
12
13
14
15
16
17
18
19
20
21
22
import matplotlib.pyplot as plt
import matplotlib as mpl

with mpl.rc_context({'font.family': 'Times New Roman',
                     'font.style': 'italic',
                    'font.weight': 'bold',
                    'font.size': 22}):
    fig, ax = plt.subplots()
    fruits = ['apple', 'blueberry', 'cherry', 'orange']
    counts = [40, 100, 30, 55]
    bar_labels = ['red', 'blue', '_red', 'orange']
    bar_colors = ['tab:red', 'tab:blue', 'tab:red', 'tab:orange']
    ax.bar(fruits, counts, label=bar_labels, color=bar_colors)
    ax.set_ylabel('fruit supply')
    ax.set_title('Fruit supply by kind and color')
    ax.legend(title='Fruit color')

    # Save the figure
    plt.savefig("fig1.png", dpi=600, bbox_inches='tight')

    # Show the figure
    plt.show()
Method 2: used as a decorator
1
2
3
4
5
6
7
8
9
10
11
12
13
14
15
16
17
18
19
20
21
22
23
24
25
import matplotlib.pyplot as plt
import matplotlib as mpl

@mpl.rc_context({'font.family': 'Times New Roman',
                     'font.style': 'italic',
                    'font.weight': 'bold',
                    'font.size': 22})
def helperPlot():
    fig, ax = plt.subplots()
    fruits = ['apple', 'blueberry', 'cherry', 'orange']
    counts = [40, 100, 30, 55]
    bar_labels = ['red', 'blue', '_red', 'orange']
    bar_colors = ['tab:red', 'tab:blue', 'tab:red', 'tab:orange']
    ax.bar(fruits, counts, label=bar_labels, color=bar_colors)
    ax.set_ylabel('fruit supply')
    ax.set_title('Fruit supply by kind and color')
    ax.legend(title='Fruit color')

    # Save the figure
    plt.savefig("fig2.png", dpi=600, bbox_inches='tight')

    # Show the figure
    plt.show()

helperPlot()

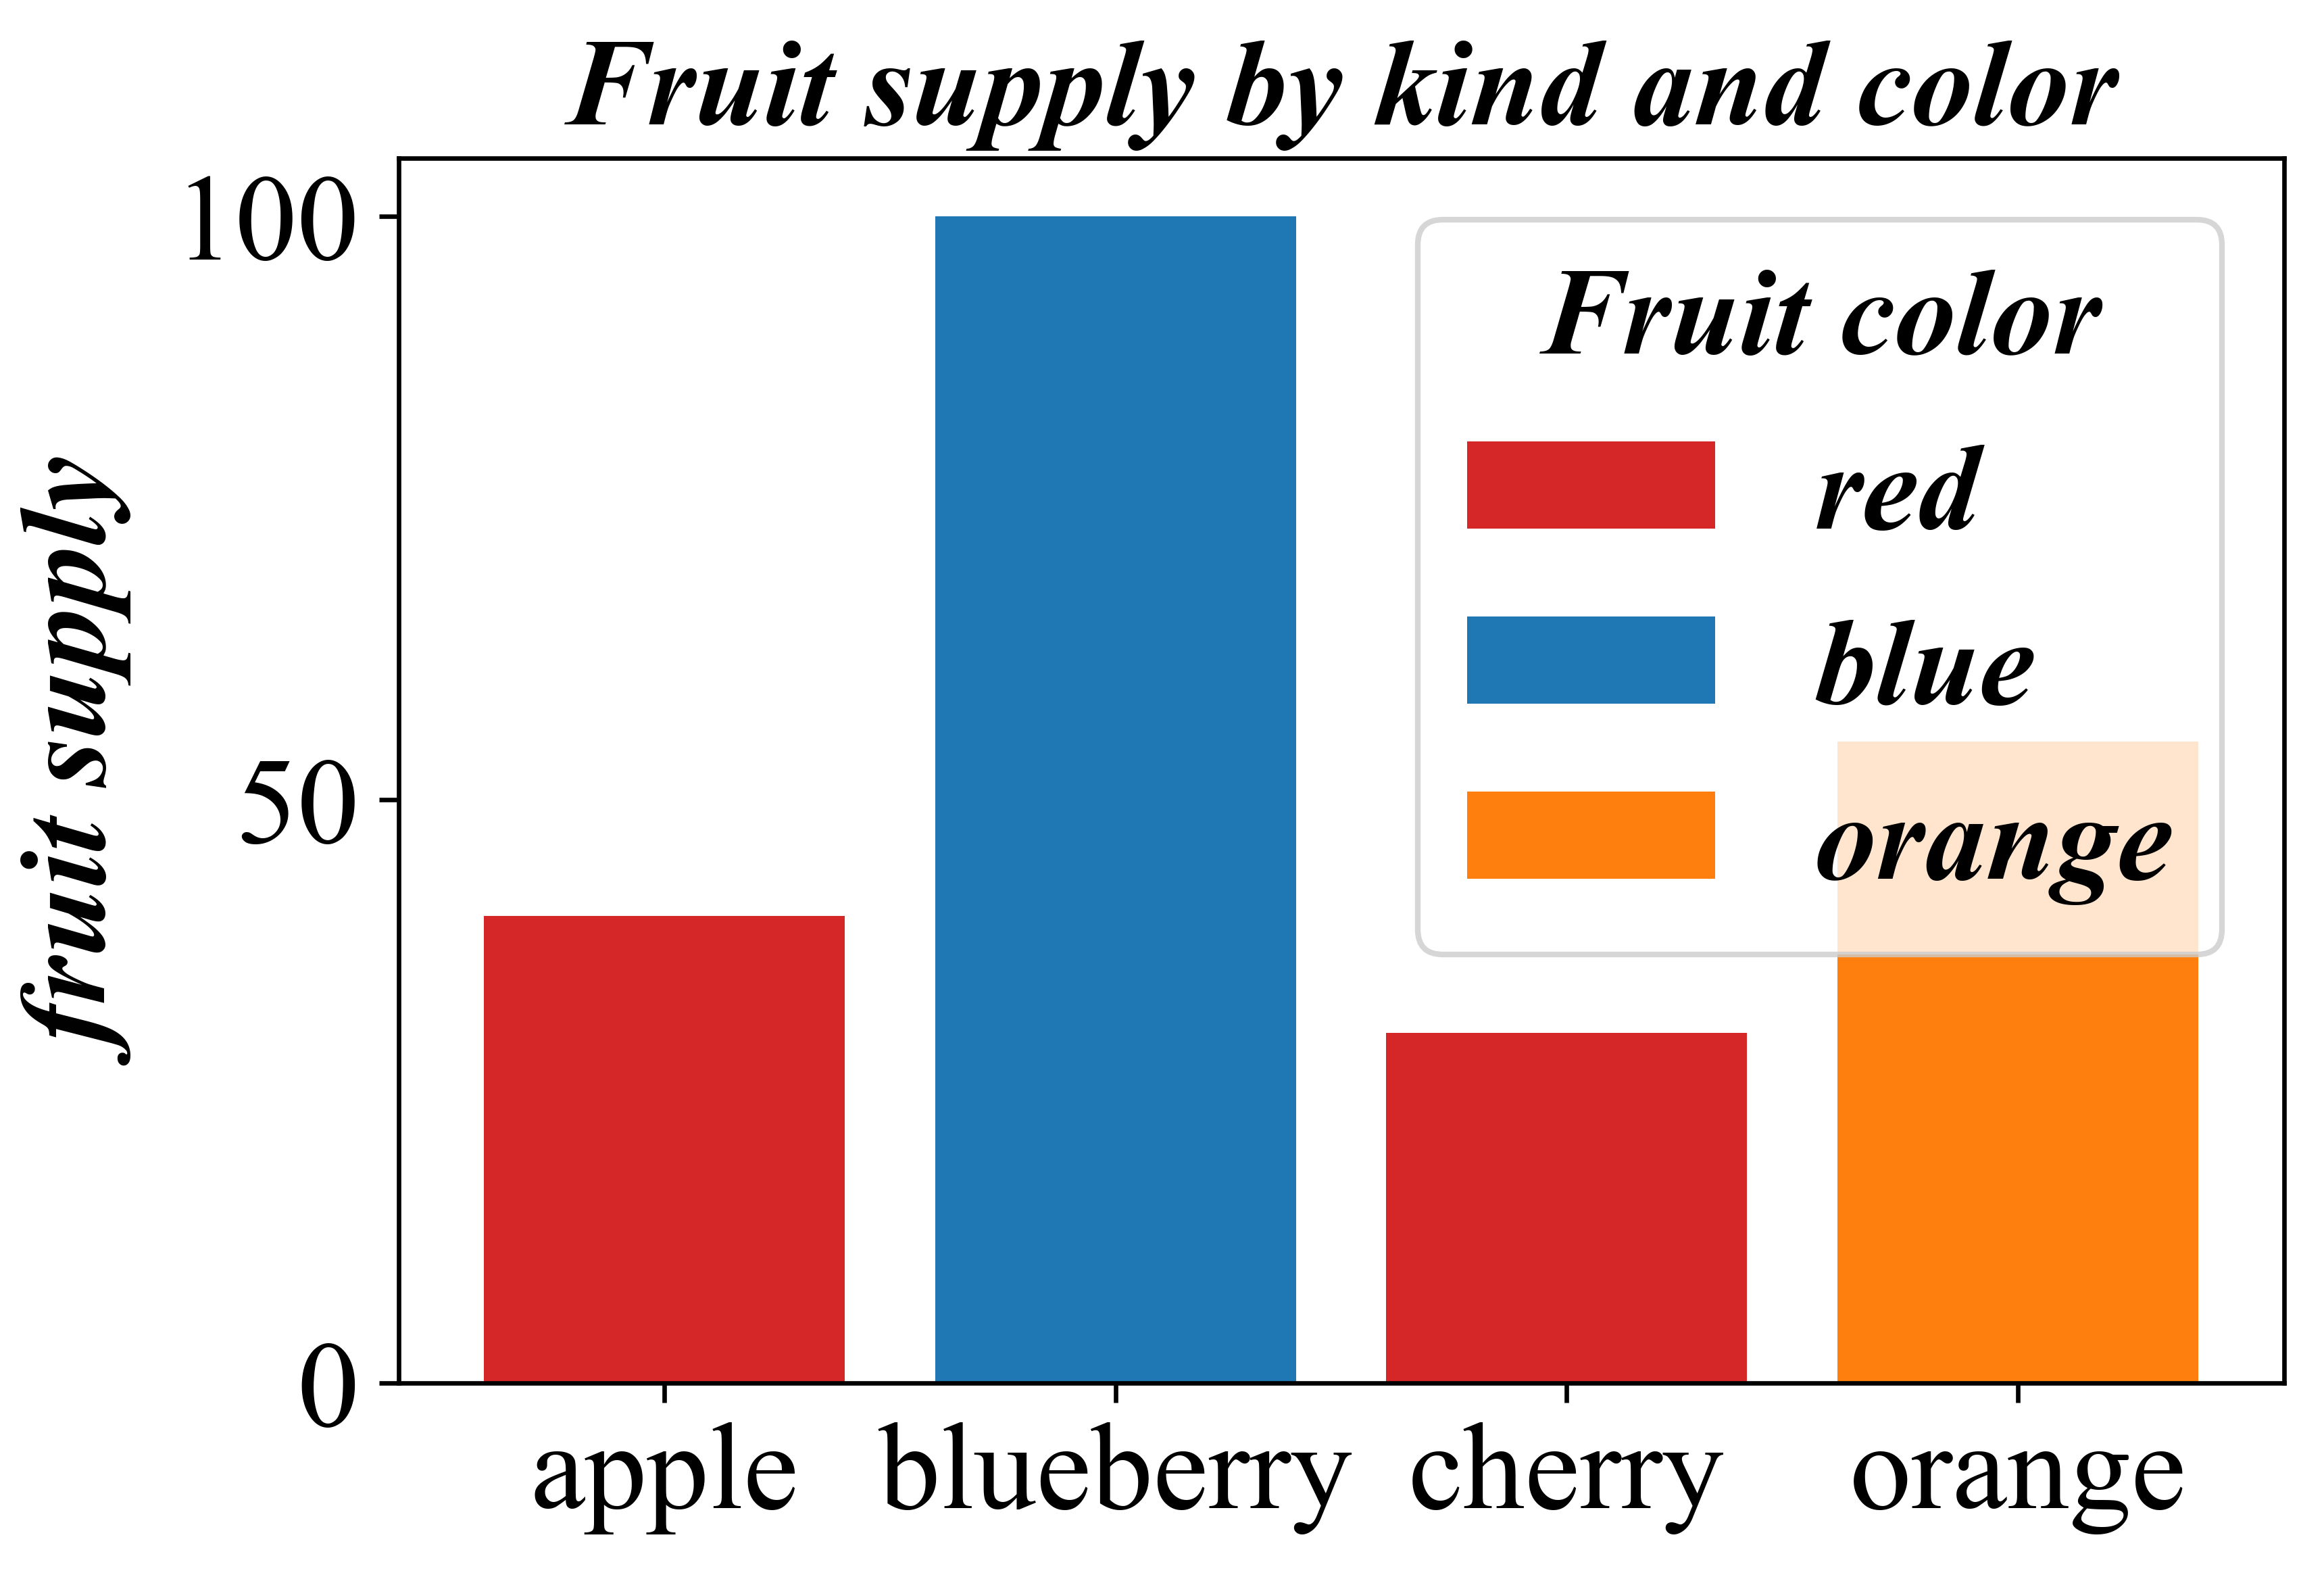
After running Script 4 and Script 5, we can get Fig. 4 and Fig. 5 which look the same as Fig. 2, but if we delete or comment the code snippet related to font settings, the text will restore to default style:
1
2
3
4
5
6
7
import matplotlib.pyplot as plt
import matplotlib as mpl

with mpl.rc_context():
    fig, ax = plt.subplots()
    fruits = ['apple', 'blueberry', 'cherry', 'orange']
    # ...
1
2
3
4
5
6
7
8
9
10
11
12
import matplotlib.pyplot as plt
import matplotlib as mpl

# @mpl.rc_context({'font.family': 'Times New Roman',
#                      'font.style': 'italic',
#                     'font.weight': 'bold',
#                     'font.size': 22})
def helperPlot():
    fig, ax = plt.subplots()
    # ...

helperPlot()
Other text properties and complete matplotlib.rcParams list
By the way, besides family, style, weight, and size, there are more text properties, which can be found in the documentation9.
And, in addition to text, matplotlib.rcParams can style much more other components, such as lines, legend, and so. A full list of rcParams can be found in the documentation10.
Specify font style LOCALLY
Besides GLOBALLY modifying rc settings (runtime or temporary), we can also style text LOCALLY by setting property of specific functions (refer to Matplotlib example11):
1
2
3
4
5
6
7
8
9
10
11
12
13
14
15
16
17
18
19
20
21
22
23
24
25
26
27
28
29
import matplotlib.pyplot as plt

fig, ax = plt.subplots()

fruits = ['apple', 'blueberry', 'cherry', 'orange']
counts = [40, 100, 30, 55]
bar_labels = ['red', 'blue', '_red', 'orange']
bar_colors = ['tab:red', 'tab:blue', 'tab:red', 'tab:orange']

# Make a font dictionary
font = {'family': 'Times New Roman',
        'style': 'italic',
        'weight': 'bold',
        'size': 22}

ax.bar(fruits,counts,label=bar_labels,color=bar_colors)

ax.set_ylabel('fruit supply', fontdict=font)
ax.set_title('Fruit supply by kind and color', fontdict=font)

ax.legend(title='Fruit color', title_fontproperties=font, prop=font)

ax.tick_params(labelsize=22, labelfontfamily='Times New Roman')

# Save the figure
plt.savefig("fig3.png", dpi=600, bbox_inches='tight')

# Show the figure
plt.show()
The properties controlling font style of different functions are different. At least in this scenario, those functions can be classified into three categories:
(1) Axes.set_ylabel12 (likewise, Axes.set_xlabel13) and Axes.set_title14 functions
The basic syntax of these functions is:
1
Axes.set_ylabel(ylabel, fontdict=None, labelpad=None, *, loc=None, **kwargs)
1
Axes.set_xlabel(xlabel, fontdict=None, labelpad=None, *, loc=None, **kwargs)
1
Axes.set_title(label, fontdict=None, loc=None, pad=None, *, y=None, **kwargs)
and Axes.text function15 in example11:
1
Axes.text(x, y, s, fontdict=None, **kwargs)
These function are only about text, so all of them provide a "fontdict" property to accept font setting dictionary.
(2) Axes.legend function16
1
Axes.legend(*args, **kwargs)
Axes.legend function is to set axes legend. It not only controls text style, but also other components appearance. So, its syntax looks different from above functions. As for text, axes legend contains two parts, i.e. legend names and legend title. And property "prop" accept font dictionary set for legend names, "title_fontproperties" for legend title.
(3) Axes.tick_params function17
Axes.tick_params function can be used to change axes tick font.
1
Axes.tick_params(axis='both', **kwargs)
As introduced in the Matplotlib documentation, Axes.tick_params function is designed to “change the appearance of ticks, tick labels, and gridlines.”17 It relates to the whole axes, therefore more complicated than above functions. This function has following valid properties:
1
valid keywords are ['size', 'width', 'color', 'tickdir', 'pad', 'labelsize', 'labelcolor', 'labelfontfamily', 'zorder', 'gridOn', 'tick1On', 'tick2On', 'label1On', 'label2On', 'length', 'direction', 'left', 'bottom', 'right', 'top', 'labelleft', 'labelbottom', 'labelright', 'labeltop', 'labelrotation', 'grid_agg_filter', 'grid_alpha', 'grid_animated', 'grid_antialiased', 'grid_clip_box', 'grid_clip_on', 'grid_clip_path', 'grid_color', 'grid_dash_capstyle', 'grid_dash_joinstyle', 'grid_dashes', 'grid_data', 'grid_drawstyle', 'grid_figure', 'grid_fillstyle', 'grid_gapcolor', 'grid_gid', 'grid_in_layout', 'grid_label', 'grid_linestyle', 'grid_linewidth', 'grid_marker', 'grid_markeredgecolor', 'grid_markeredgewidth', 'grid_markerfacecolor', 'grid_markerfacecoloralt', 'grid_markersize', 'grid_markevery', 'grid_mouseover', 'grid_path_effects', 'grid_picker', 'grid_pickradius', 'grid_rasterized', 'grid_sketch_params', 'grid_snap', 'grid_solid_capstyle', 'grid_solid_joinstyle', 'grid_transform', 'grid_url', 'grid_visible', 'grid_xdata', 'grid_ydata', 'grid_zorder', 'grid_aa', 'grid_c', 'grid_ds', 'grid_ls', 'grid_lw', 'grid_mec', 'grid_mew', 'grid_mfc', 'grid_mfcalt', 'grid_ms']
Axes.tick_params function seem not supported for accepting font setting dictionary, only providing three properties for setting tick font style, labelsize, labelcolor, and labelfontfamily. And as a result, I didn’t find a suitable way to make tick label bold and italic. But doesn’t matter, this is an uncommon requirement.
By the way, specifying font style by function properties is a temporary behavior which doesn’t last for entire runtime; it doesn’t affect rcParams settings.
Conclusions
In this post, I’ve explored how to set font style GLOBALLY and LOCALLY when using Python Matplotlib package to plot figures. In short, the former is realized by modifying rcParams, whereas the latter by specifying function properties.
Both methods have their own pros and cons:
(1) GLOBALLY-method can help to create a consistent style (not just for fonts), making a uniform style. And furthermore, users can customize their own styles using matplotlibrc and .mplstyle files, which have strong relationship with rcParams settings and more detailed information about these two files can be found in my blog18.
(2) GLOBALLY-method will make settings always functional throughout entire runtime, therefore, we should restart IDE or use matplotlib.style.use("default") to restore default settings. Or, we can use matplotlib.rc_context function to make temporary rcParams settings.
(3) For figures Fig. 1-Fig. 5 set by GLOBALLY-method, specifying plt.rcParams["font.weight"] as "bold" (or "heavy"19) doesn’t work for y-label and title text. But for Fig. 7, specified by LOCALLY-method, we can successfully change font weight by setting "fontdict" property.
(4) For Fig. 7 by LOCALLY-method, as mentioned before, I don’t know how to make tick label bold and italic at this moment.
From my point of view, I prefer specifying the font style for each text when needed, i.e. LOCALLY-method, because it’s more flexible.
References
-
matplotlib.pyplot.savefig— Matplotlib 3.9.0 documentation. ˄ -
matplotlib:
matplotlib.rcdefaults— Matplotlib 3.9.0 documentation. ˄ -
Customizing Matplotlib with style sheets and
rcParams— Matplotlib 3.9.0 documentation. ˄ -
Customizing Matplotlib with style sheets and
rcParams: Temporary rc settings — Matplotlib 3.9.0 documentation. ˄ ˄2 ˄3 -
matplotlib.pyplot.rc_context— Matplotlib 3.9.0 documentation. ˄ -
Text properties and layout — Matplotlib 3.9.0 documentation. ˄
-
matplotlib: Default values and styling — Matplotlib 3.9.0 documentation. ˄
-
Controlling style of text and labels using a dictionary — Matplotlib 3.9.0 documentation. ˄ ˄2
-
matplotlib.axes.Axes.set_ylabel— Matplotlib 3.9.0 documentation. ˄ -
matplotlib.axes.Axes.set_xlabel— Matplotlib 3.9.0 documentation. ˄ -
matplotlib.axes.Axes.set_title— Matplotlib 3.9.0 documentation. ˄ -
matplotlib.axes.Axes.text— Matplotlib 3.9.0 documentation. ˄ -
matplotlib.axes.Axes.legend— Matplotlib 3.9.0 documentation. ˄ -
matplotlib.axes.Axes.tick_params— Matplotlib 3.9.0 documentation. ˄ ˄2 -
Customize Figure Style when Plotting by Python Matplotlib Package: matplotlibrc File and .mplstyle File - WHAT A STARRY NIGHT~. ˄
-
Fonts demo (keyword arguments) — Matplotlib 3.9.0 documentation. ˄