Customize Figure Caption Style in LaTeX System
Customise figure caption style globally
For figure in figure environment, the default caption style are as follows:
1
2
3
4
5
6
7
8
9
10
11
12
13
14
15
16
17
18
19
20
21
22
23
24
25
26
27
28
29
\documentclass{article}
\usepackage{geometry}
\geometry{a4paper}
\usepackage{graphicx,subfig}

\begin{document}
	\begin{figure}
		\centering
		\includegraphics[width=0.2\textwidth]{pic-1.pdf}
		\caption{This is a random data series 1, and here is short caption.}
		\vspace{-20em}
	\end{figure}
	\begin{figure}
		\centering
		\includegraphics[width=0.2\textwidth]{pic-2.pdf}
		\caption{This is a random data series 2, and here is long long long long long long long long long long caption.}
		\vspace{-20em}
	\end{figure}
	\begin{figure}
		\def\CE{0.20}
		\centering
		\subfloat[]{\includegraphics[height=\CE\textwidth,width=\CE\textwidth]{pic-1.pdf}\label{fig-a}}\hfill
		\subfloat[]{\includegraphics[height=\CE\textwidth,width=\CE\textwidth]{pic-2.pdf}}\hfill
		\subfloat[]{\includegraphics[height=\CE\textwidth,width=\CE\textwidth]{pic-3.pdf}}\hfill
		\subfloat[]{\includegraphics[height=\CE\textwidth, width=\CE\textwidth]{pic-4.pdf}}
		\caption{This is a set of random data series.}
		\label{fig}
	\end{figure}
\end{document}
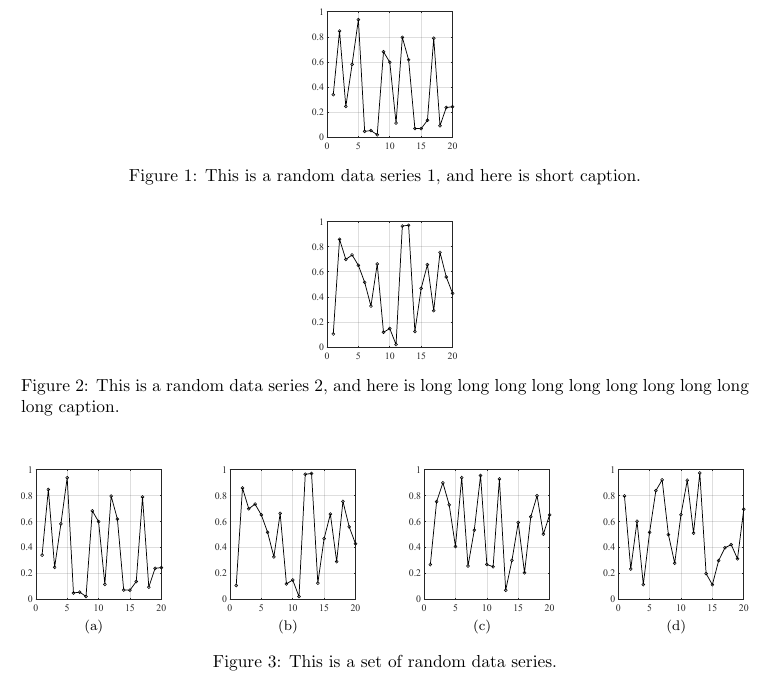
As can be seen:
(1) The figure label style is like: Figure xxx;
(2) The figure title is centered, but if it is too long, figure environment will automatically start it at the left side.
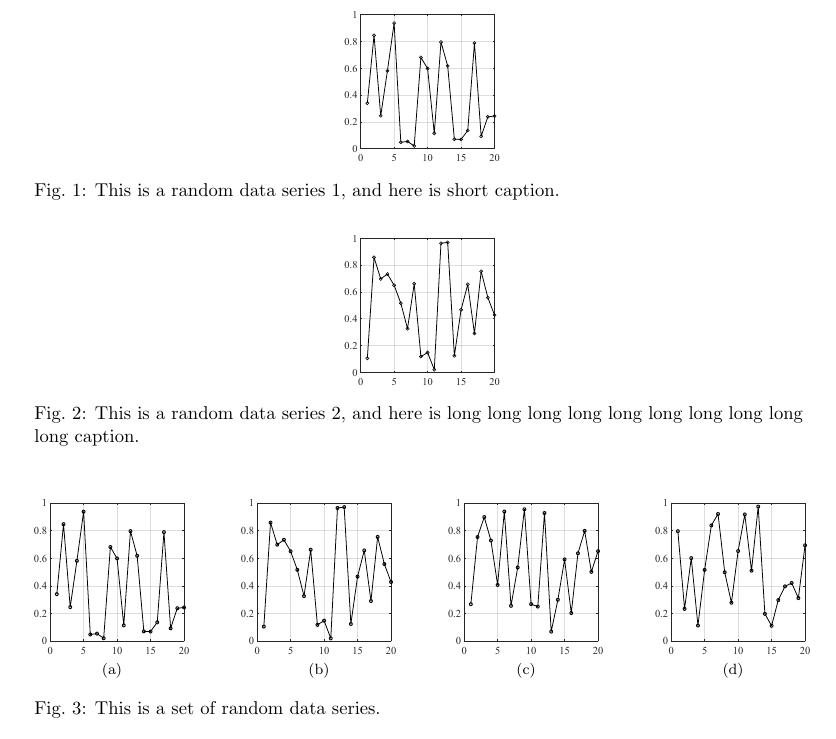
In some LaTeX templates, like the paper template provided by IEEE transactions, the figure label style is Fig. xxx and the title is always ragged right. We could globally define the similar caption style in the preamble area:
(1) Customise figure label
1
\renewcommand{\figurename}{Fig.}
(2) Customise figure title
1
2
\captionsetup[figure]{justification=raggedright,singlelinecheck=false}
\captionsetup[subfigure]{justification=centering}
The first line is specifying settings for figure title, whereas the second is for subfigure title. The meaning of both is literately obvious, but we should highlight the option singlelinecheck=false for figure. Specifying false for singlelinecheck means that figure title is ALWAYS set to ragged right even if it just occupies one line (rather than centered as default true value). Actually, the default caption style of figure environment, showed as before, is explicitly \captionsetup[figure]{justification=raggedright,singlelinecheck=true}.
By the way, do not forget to set for subfigure \captionsetup[subfigure]{justification=centering}, otherwise, the subfigure title will be set to the same style like figure, i.e., ragged right, rather than centered.
The completely code and effect show as followings:
1
2
3
4
5
6
7
8
9
10
11
12
13
14
15
16
17
18
19
20
21
22
23
24
25
26
27
28
29
30
31
32
33
34
35
\documentclass{article}
\usepackage{geometry}
\geometry{a4paper}
\usepackage{graphicx,subfig}

\renewcommand{\figurename}{Fig.}

\captionsetup[figure]{justification=raggedright,singlelinecheck=false}
\captionsetup[subfigure]{justification=centering}

\begin{document}

	\begin{figure}
		\centering
		\includegraphics[width=0.2\textwidth]{pic-1.pdf}
		\caption{This is a random data series 1, and here is short caption.}
		\vspace{-20em}
	\end{figure}
	\begin{figure}
		\centering
		\includegraphics[width=0.2\textwidth]{pic-2.pdf}
		\caption{This is a random data series 2, and here is long long long long long long long long long long caption.}
		\vspace{-20em}
	\end{figure}
	\begin{figure}
		\def\CE{0.20}
		\centering
		\subfloat[]{\includegraphics[height=\CE\textwidth,width=\CE\textwidth]{pic-1.pdf}\label{fig-a}}\hfill
		\subfloat[]{\includegraphics[height=\CE\textwidth,width=\CE\textwidth]{pic-2.pdf}}\hfill
		\subfloat[]{\includegraphics[height=\CE\textwidth,width=\CE\textwidth]{pic-3.pdf}}\hfill
		\subfloat[]{\includegraphics[height=\CE\textwidth, width=\CE\textwidth]{pic-4.pdf}}
		\caption{This is a set of random data series.}
		\label{fig}
	\end{figure}
\end{document}
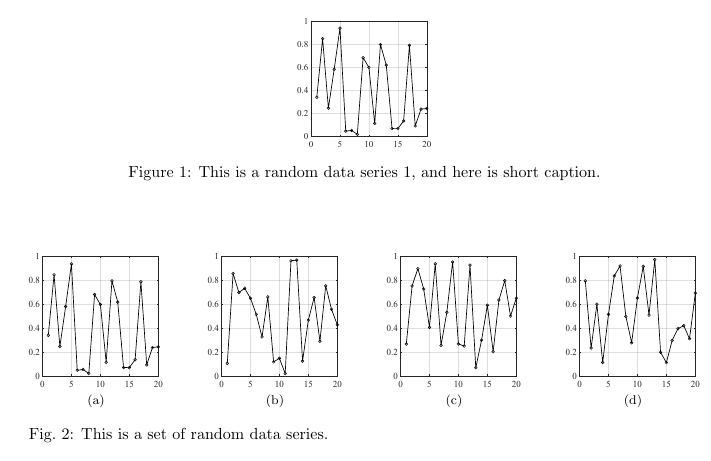
Customise figure caption style locally
On the other, we could specify caption style locally by using aforementioned control sequence \captionsetup in the figure environment, like \captionsetup{type=figure,name=Fig.,justification=raggedright,singlelinecheck=false}:
1
2
3
4
5
6
7
8
9
10
11
12
13
14
15
16
17
18
19
20
21
22
23
24
25
\documentclass{article}
\usepackage{geometry}
\geometry{a4paper}
\usepackage{graphicx,subfig}

\begin{document}
	\begin{figure}
		\centering
		\includegraphics[width=0.2\textwidth]{pic-1.pdf}
		\caption{This is a random data series 1, and here is short caption.}
		\vspace{-30em}
	\end{figure}

	\begin{figure}
		\def\CE{0.20}
		\centering
		\subfloat[]{\includegraphics[height=\CE\textwidth,width=\CE\textwidth]{pic-1.pdf}\label{fig-a}}\hfill
		\subfloat[]{\includegraphics[height=\CE\textwidth,width=\CE\textwidth]{pic-2.pdf}}\hfill
		\subfloat[]{\includegraphics[height=\CE\textwidth,width=\CE\textwidth]{pic-3.pdf}}\hfill
		\subfloat[]{\includegraphics[height=\CE\textwidth, width=\CE\textwidth]{pic-4.pdf}}
		\captionsetup{type=figure,name=Fig.,justification=raggedright,singlelinecheck=false}
		\caption{This is a set of random data series.}
		\label{fig}
	\end{figure}
\end{document}
Reference
[1] 刘海洋编著. LaTeX入门. 北京: 电子工业出版社, 2013.6.