MATLAB findobj Function — Find graphics objects with specific properties
Oct. 31, 2025 in Buffalo, United States • Updated Nov. 02, 2025
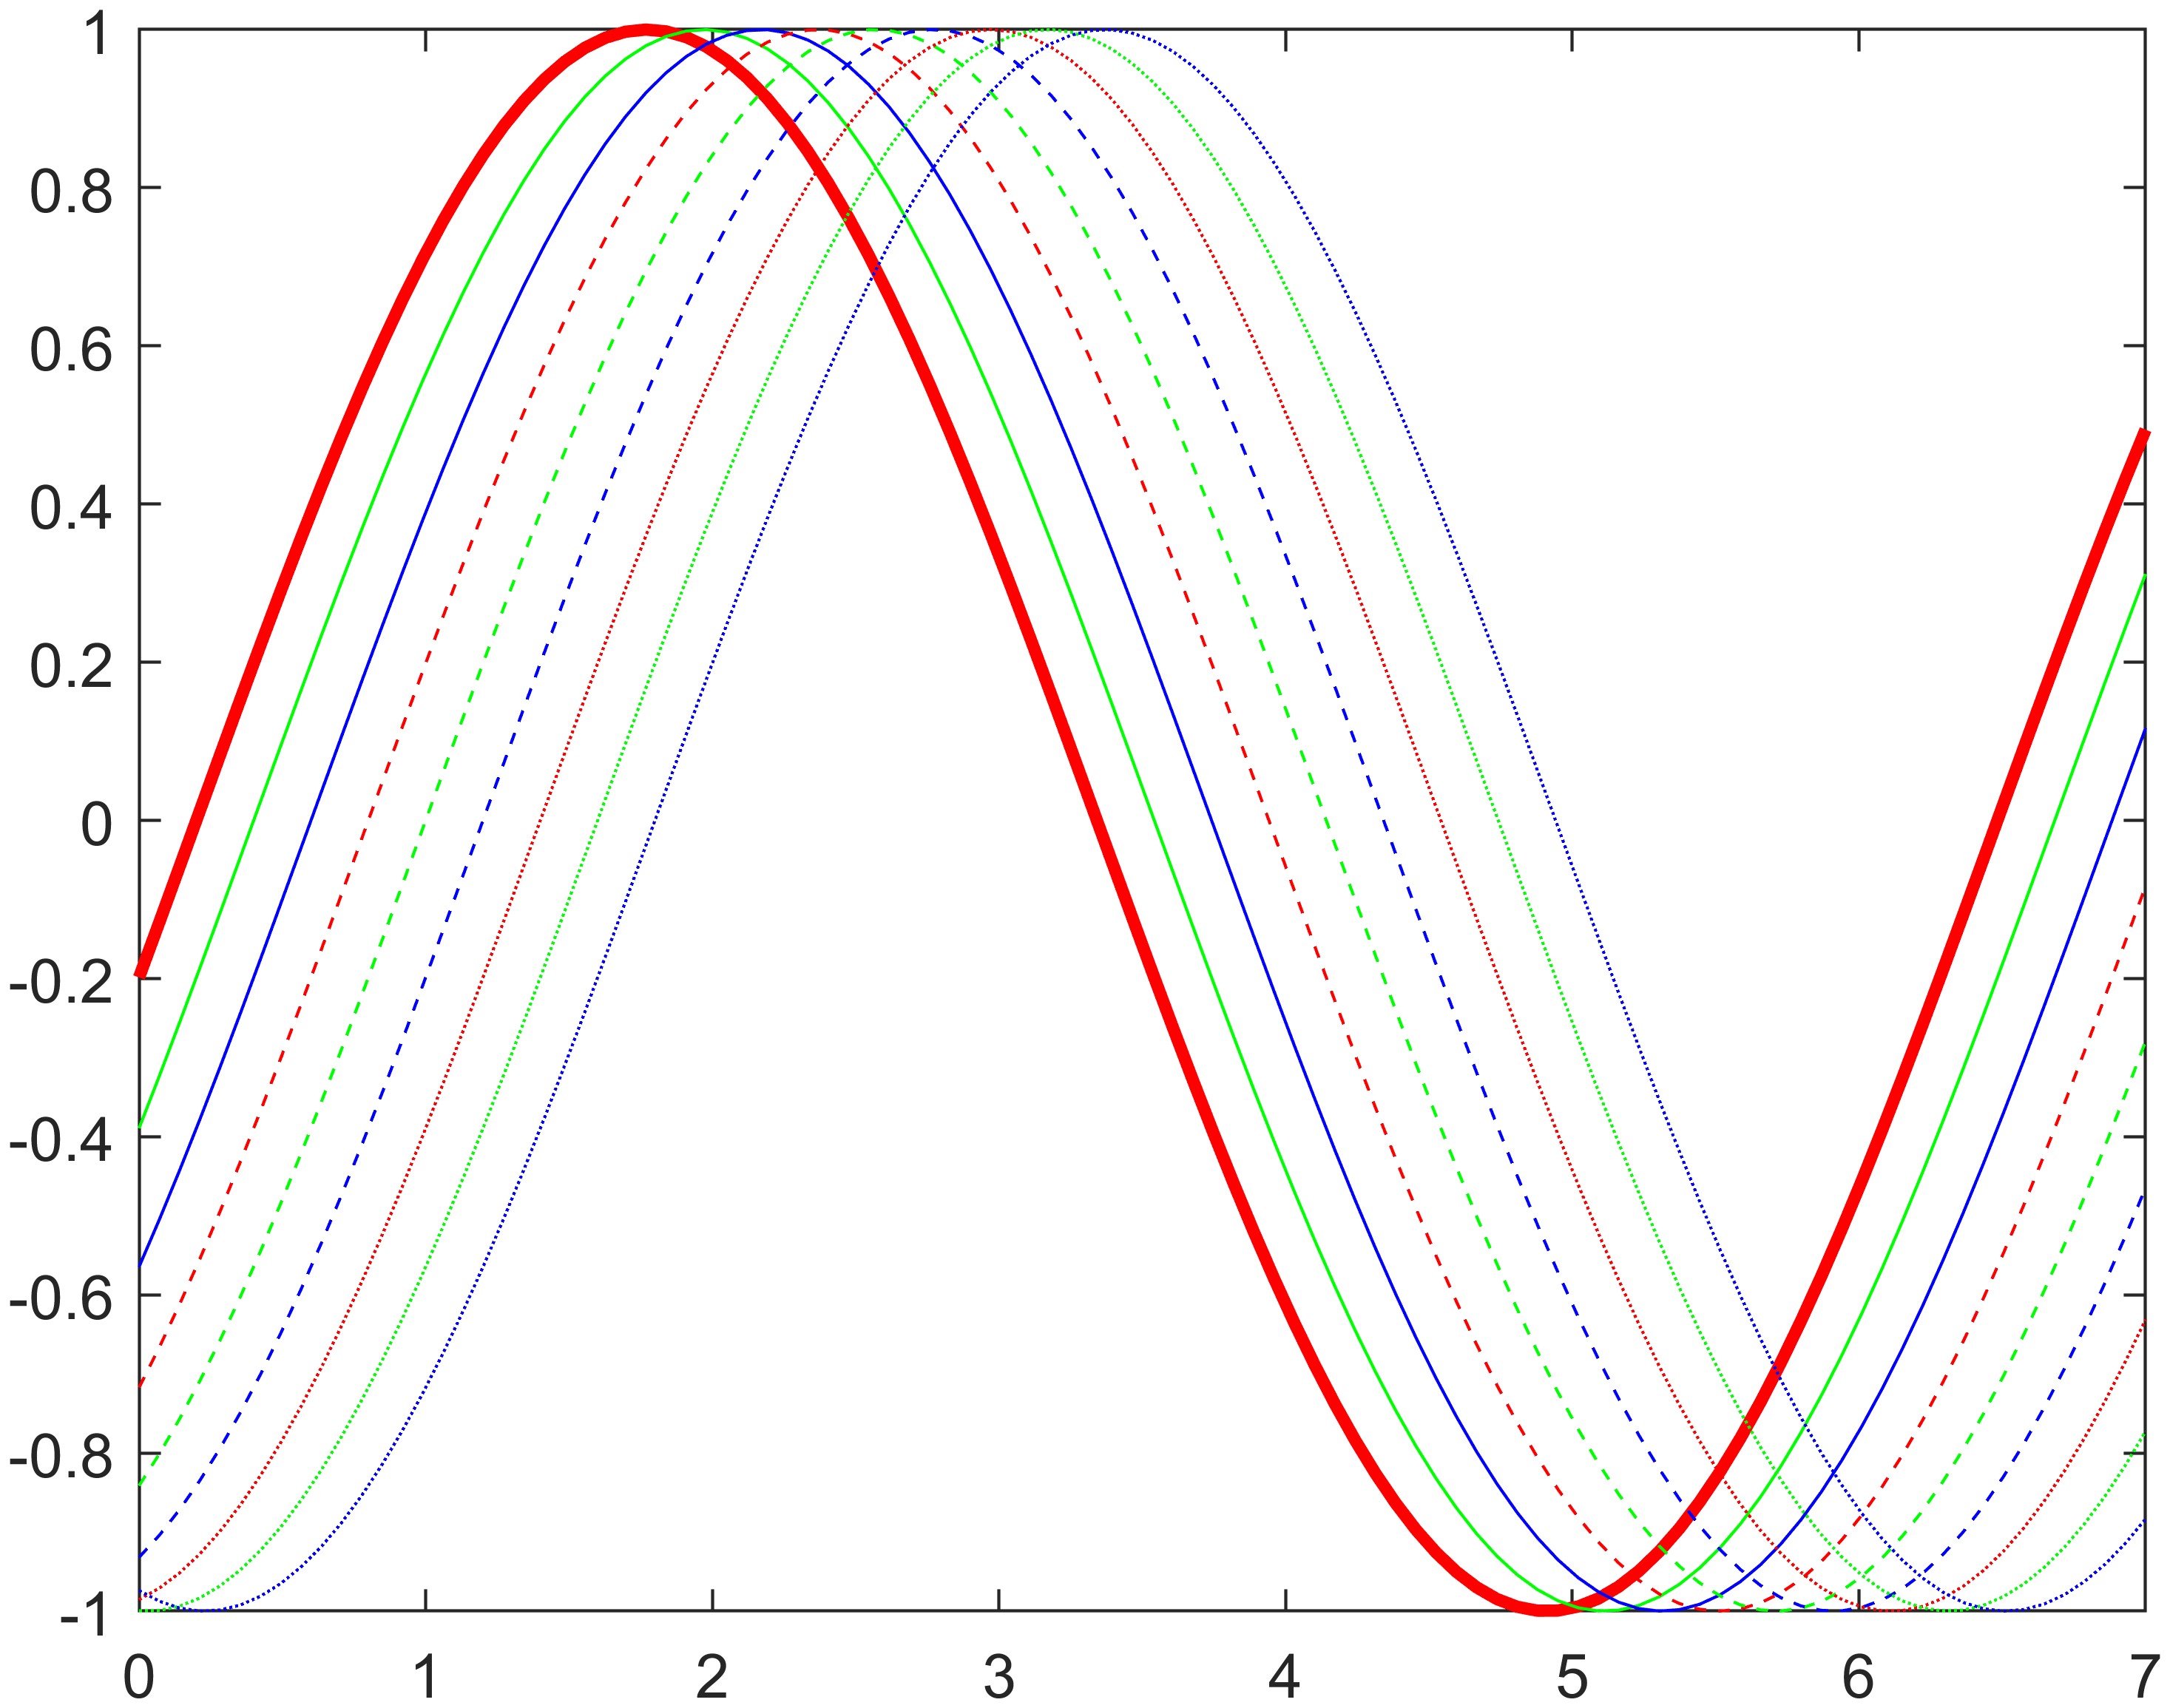
MATLAB findobj function is used to “find graphics objects with specific properties”1, and here are three examples from the official document1:
(1) Find Objects with Specified Property Values
1
2
3
4
5
6
7
8
9
10
11
12
13
14
15
16
17
18
clc, clear, close all

x = linspace(0,7);
y = ones(length(x),9);
for i = 1:9
    y(:,i) = sin(x-i/5)';
end
plot(x,y)

colororder({'red','green','blue'})
ax = gca;
ax.LineStyleOrder = {'-','--',':'};

h = findobj('Color','red','LineStyle','-');

h.LineWidth = 2;

exportgraphics(ax, 'fig1.jpg', 'Resolution', 600)

(2) Find Objects Using Logical Expressions
1
2
3
4
5
6
7
8
9
10
11
12
13
14
15
16
17
18
19
20
21
22
23
24
25
clc, clear, close all

x = linspace(-1,1);
y1 = x;
plot(x,y1,'Tag','linear')
hold on
y2 = x.^2;
plot(x,y2,'Tag','quadratic')
y3 = exp(x);
plot(x,y3,'Tag','exponential')
y4 = sin(x);
plot(x,y4,'Tag','sinusoidal')
hold off

% Find all objects whose Tag property is not set to 'linear'
h1 = findobj('-not','Tag','linear')

% h2 = findobj('-not',{'Tag','linear','-or','Tag','quadratic'})
h2 = findobj('-not',{'Tag','linear','-or','Tag','quadratic'})

% Find all line objects whose Tag property is not set to 'linear' or 'quadratic'.
h3 = findobj('Type','line','-not',{'Tag','linear','-or','Tag','quadratic'})

% Improve the readability of the previous statement by using '-and' and curly brackets.
h4 = findobj({'Type','line'},'-and',{'-not',{'Tag','linear','-or','Tag','quadratic'}})
1
2
3
4
5
6
7
8
9
10
11
12
13
14
15
16
17
18
19
20
21
22
23
24
25
26
h1 =
  6×1 graphics array:
  Root
  Figure    (1)
  Axes
  Line      (sinusoidal)
  Line      (exponential)
  Line      (quadratic)

h2 =
  5×1 graphics array:
  Root
  Figure    (1)
  Axes
  Line      (sinusoidal)
  Line      (exponential)

h3 =
  2×1 Line array:
  Line    (sinusoidal)
  Line    (exponential)

h4 =
  2×1 Line array:
  Line    (sinusoidal)
  Line    (exponential)
It is almost the first time for me to know the Tag property; before I always frequently use the DisplayName property (which is for displaying legend and actually very different from Tag though). The Tag looks like an internal name, like the name created by \label in LaTeX, and we can refer it later. Interesting!
(3) Find Objects Using Regular Expression
1
2
3
4
5
6
7
8
9
10
11
12
13
clc, clear, close all

x = linspace(-1,1);
y1 = x;
plot(x,y1)
hold on
y2 = x.^2;
plot(x,y2,'Tag','Quadratic')
y3 = exp(x);
plot(x,y3,'Tag','Exponential')
hold off

h = findobj('-regexp','Tag','[^'']')
1
2
3
4
h =
  2×1 Line array:
  Line    (Exponential)
  Line    (Quadratic)
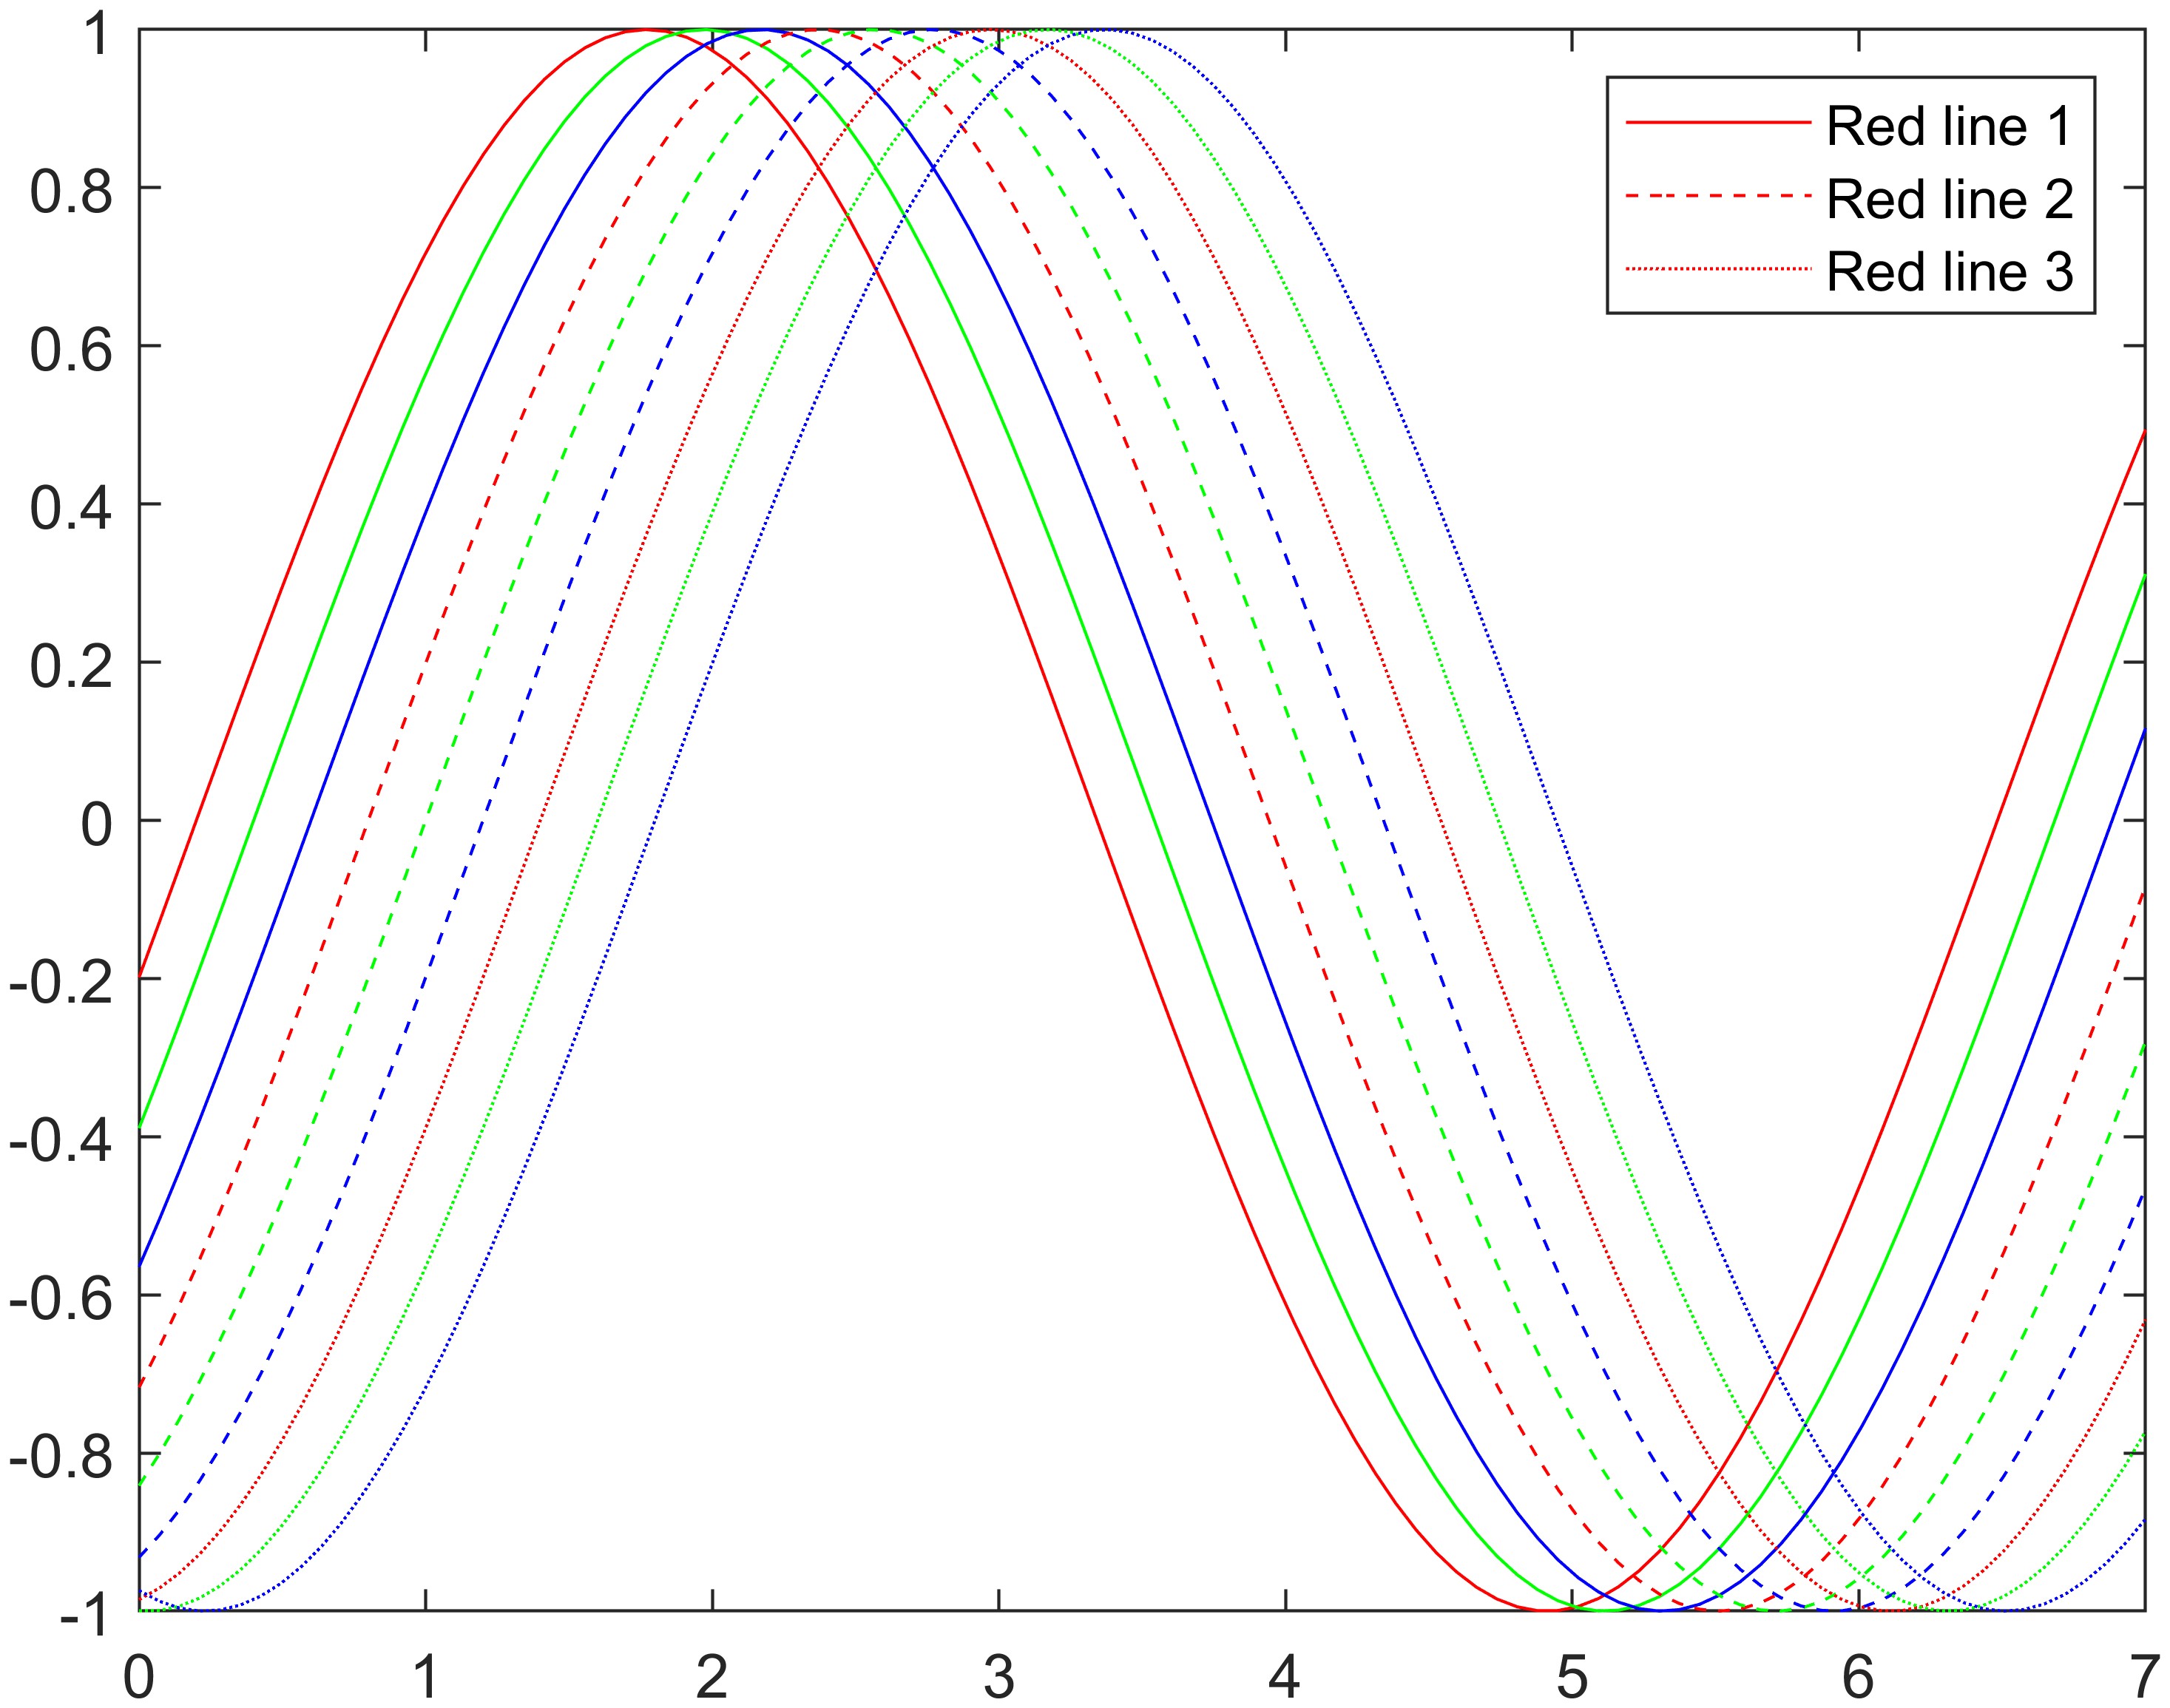
Besides, another important use of this function, to my mind, is to add legends for a few certain (not all) components, like:
1
2
3
4
5
6
7
8
9
10
11
12
13
14
15
16
17
18
19
20
clc, clear, close all

x = linspace(0,7);
y = ones(length(x),9);
for i = 1:9
    y(:,i) = sin(x-i/5)';
end
plot(x,y)

colororder({'red','green','blue'})
ax = gca;
ax.LineStyleOrder = {'-','--',':'};

h1 = findobj('Color','red','LineStyle','-');
h2 = findobj('Color','red','LineStyle','--');
h3 = findobj('Color','red','LineStyle',':');

legend([h1, h2, h3], 'Red line 1', 'Red line 2', 'Red line 3')

exportgraphics(ax, 'fig2.jpg', 'Resolution', 600)

References