A Warning of Using boxplot on tiledlayout in MATLAB; Comparison between boxchart and boxplot
A warning of using boxplot on tiledlayout
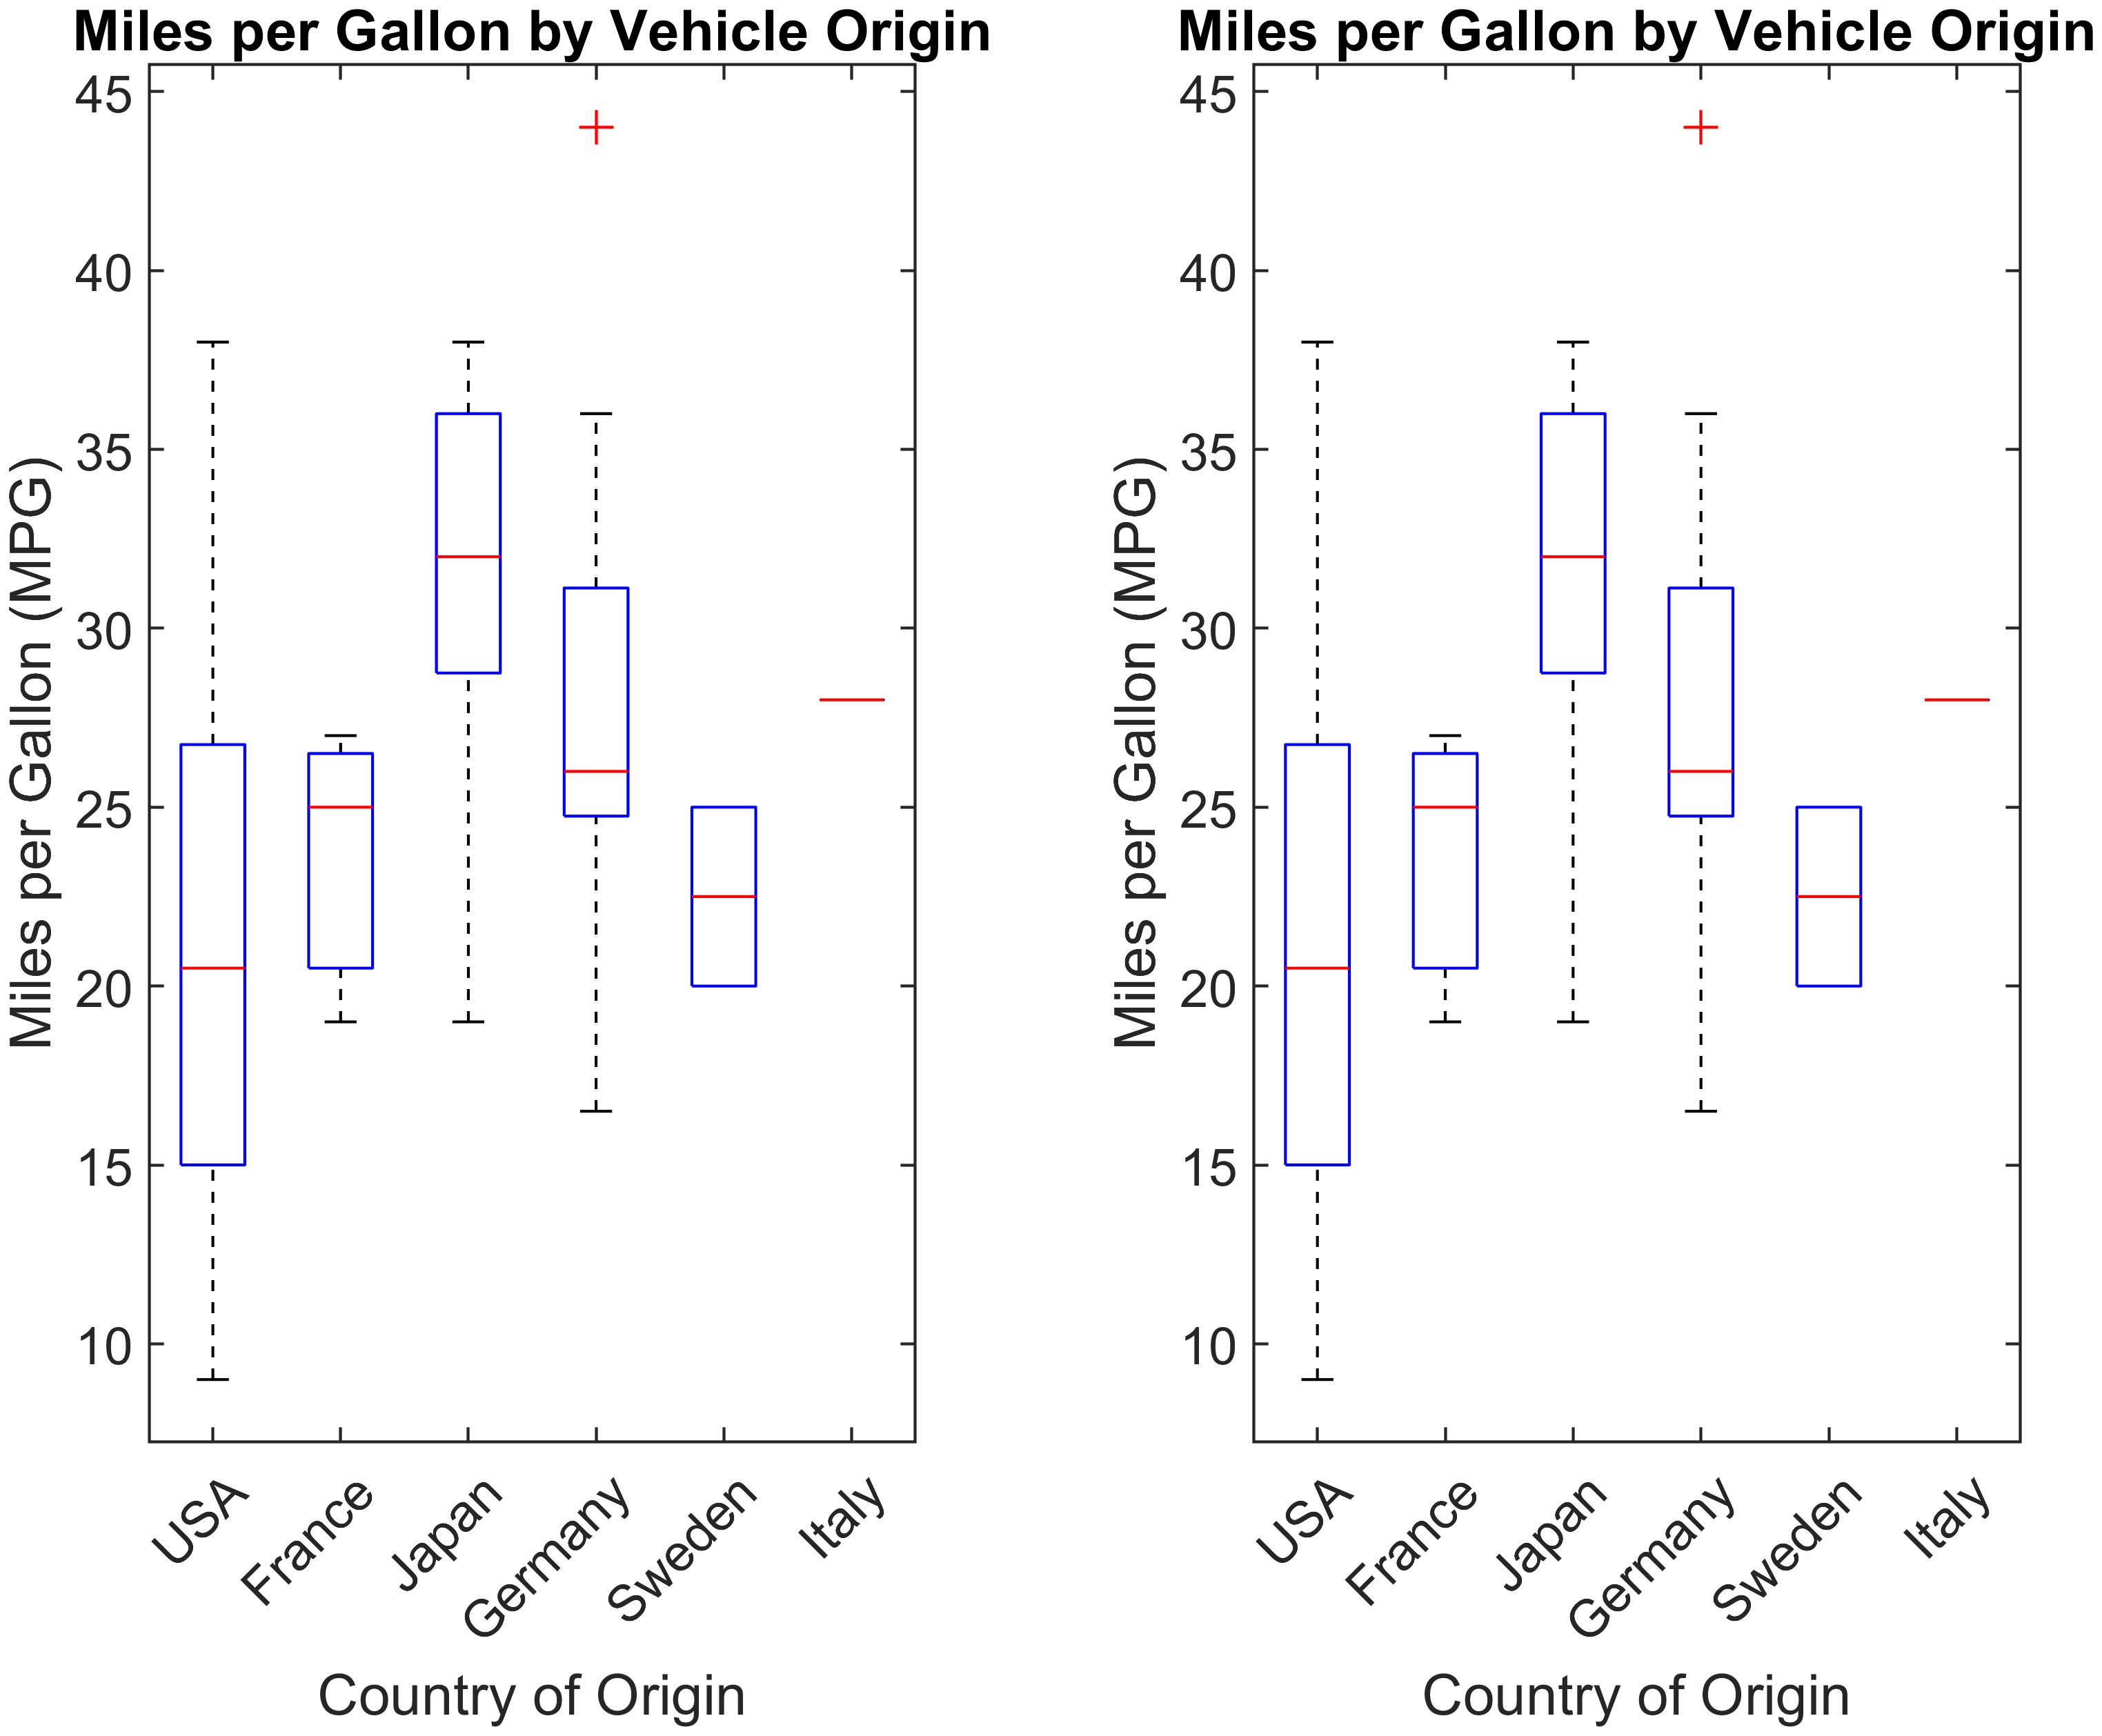
Days ago, when I used boxplot function1 in the tile generated by tiledlayout function2, a warning occurred:
1
2
3
4
5
Warning: boxplot might not be displayed properly in the tiled chart layout.
> In boxplot>renderLabels/setLabelappdata (line 3039)
In boxplot>renderLabels (line 2942)
In boxplot (line 428)
In pes16_plotScalabilityinTwoFig (line 54)
It didn’t actually affect the figure, at least for my case, but this operation indeed crops the box plot sometimes3. And I think the accepted answer in3 analyzes this warning well:
The boxplot function uses a local function setLabelappdata() to adjust the axes’ OuterPosition, PositionConstraint & LooseInset properties after the boxplots are rendered. However, these properties are not editable in axes created by TiledLayout. Matlab throws a warning. Hopefully MathWorks will either address this problem or make the position properties of tiledChartLayout objects editable.
1
2
Warning: Unable to set 'Position', 'InnerPosition', 'OuterPosition', or
'ActivePositionProperty' for objects in a TiledChartLayout
This is reasonable, because I encountered the above warning several times when I tried to adjust one axes’ position on the tiled layout.
Right now, we can reproduce the boxplot-tiledlayout warning like this:
then we’ll see two warnings:
1
2
3
4
5
6
7
8
9
10
Warning: boxplot might not be displayed properly in the tiled chart layout.
> In boxplot>renderLabels/setLabelappdata (line 3039)
In boxplot>renderLabels (line 2942)
In boxplot (line 428)
In script5 (line 9)
Warning: boxplot might not be displayed properly in the tiled chart layout.
> In boxplot>renderLabels/setLabelappdata (line 3039)
In boxplot>renderLabels (line 2942)
In boxplot (line 428)
In script5 (line 15)
Then, one idea just occurred to me: before I frequently use tiledlayout to organize subplots, I used subplot function4 a lot5, so I test if boxplot works well with subplot:
1
2
3
4
5
6
7
8
9
10
11
12
13
14
15
16
17
18
19
clc, clear, close all

load carsmall

figure('Color', 'w')

subplot(1,2,1)
boxplot(MPG,Origin)
title('Miles per Gallon by Vehicle Origin')
xlabel('Country of Origin')
ylabel('Miles per Gallon (MPG)')

subplot(1,2,2)
boxplot(MPG,Origin)
title('Miles per Gallon by Vehicle Origin')
xlabel('Country of Origin')
ylabel('Miles per Gallon (MPG)')

exportgraphics(gcf, 'fig2.jpg', 'Resolution', 600)
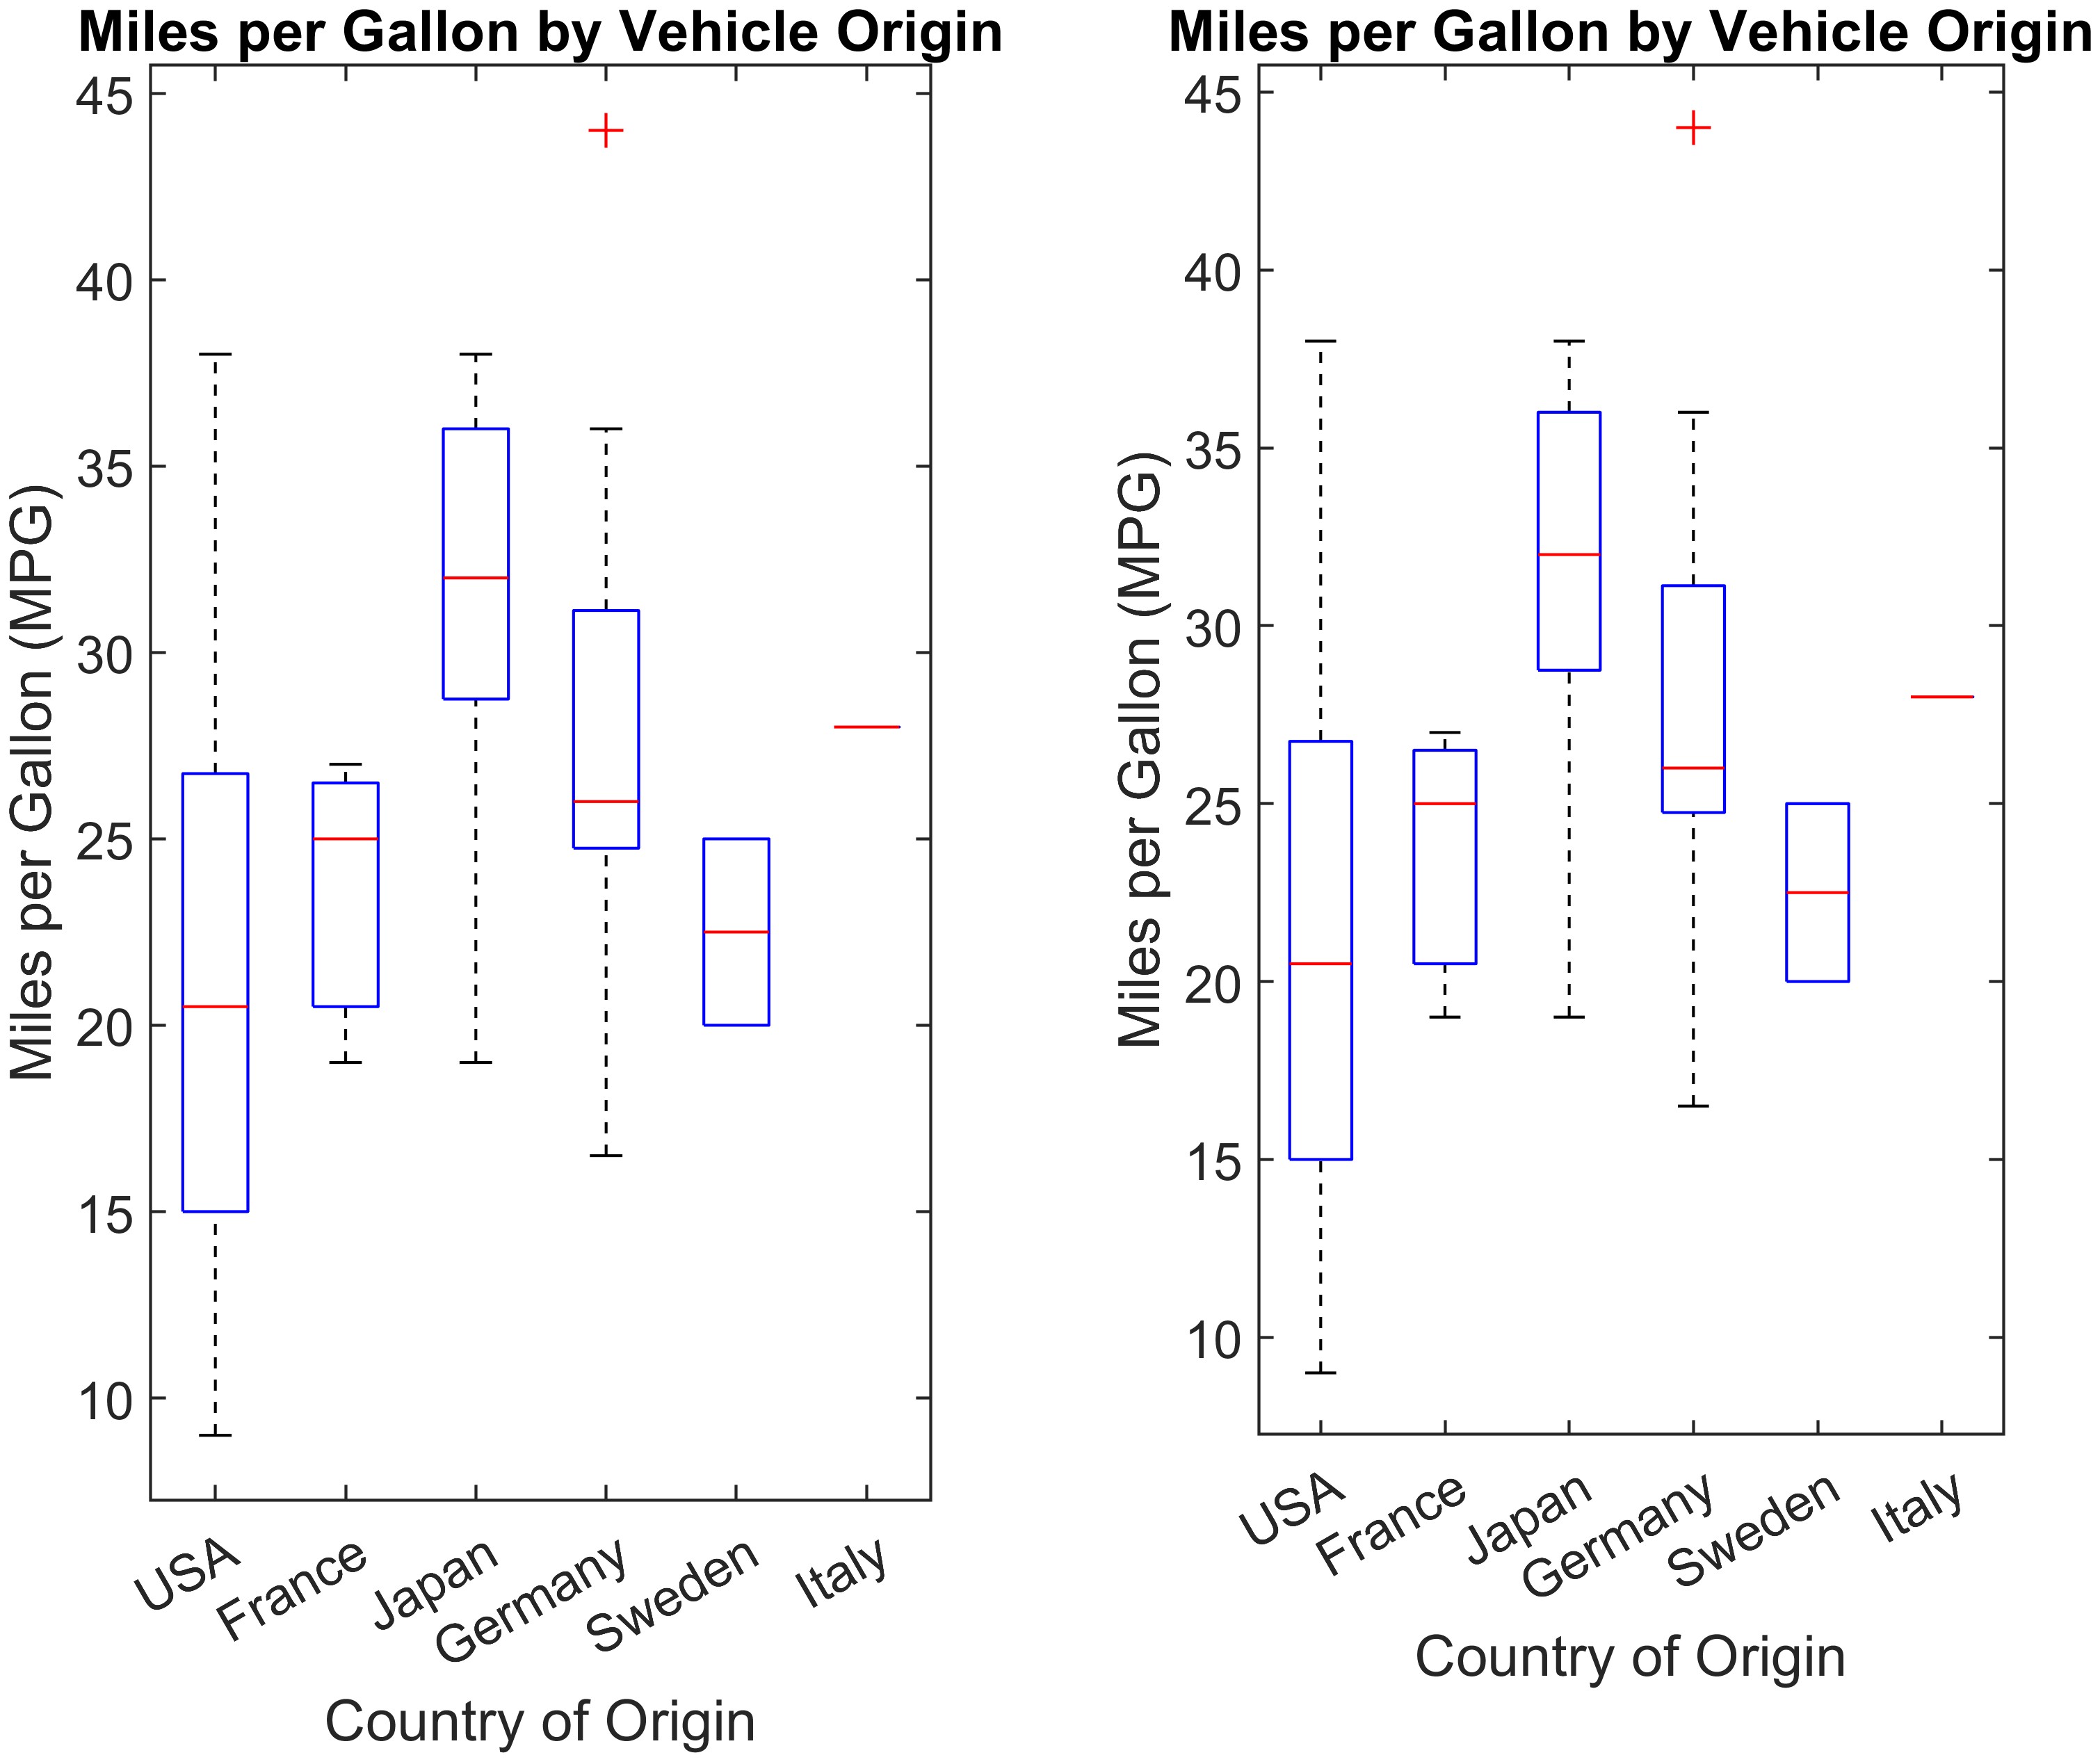
At this point, the warning disappear! So, I guess this is a compatibility issue.
Then, I looked up some information online, and I found actually there is another function boxchart6 to realize a very similar effect as boxplot, so I just wanted to try if boxchart is compatible with tiledlayout:
1
2
3
4
5
6
7
8
9
10
11
12
13
14
15
16
17
18
19
20
21
22
23
24
clc, clear, close all

load carsmall

figure('Color', 'w')
tiledlayout(1, 2)

% class(Origin) % 'char'
Origin = categorical(cellstr(Origin)); % Note well here
% class(Origin) % 'categorical'

nexttile
boxchart(Origin, MPG) % Note well here
title('Miles per Gallon by Vehicle Origin')
xlabel('Country of Origin')
ylabel('Miles per Gallon (MPG)')

nexttile
boxchart(Origin, MPG) % Note well here
title('Miles per Gallon by Vehicle Origin')
xlabel('Country of Origin')
ylabel('Miles per Gallon (MPG)')

exportgraphics(gcf, 'fig3.jpg', 'Resolution', 600)
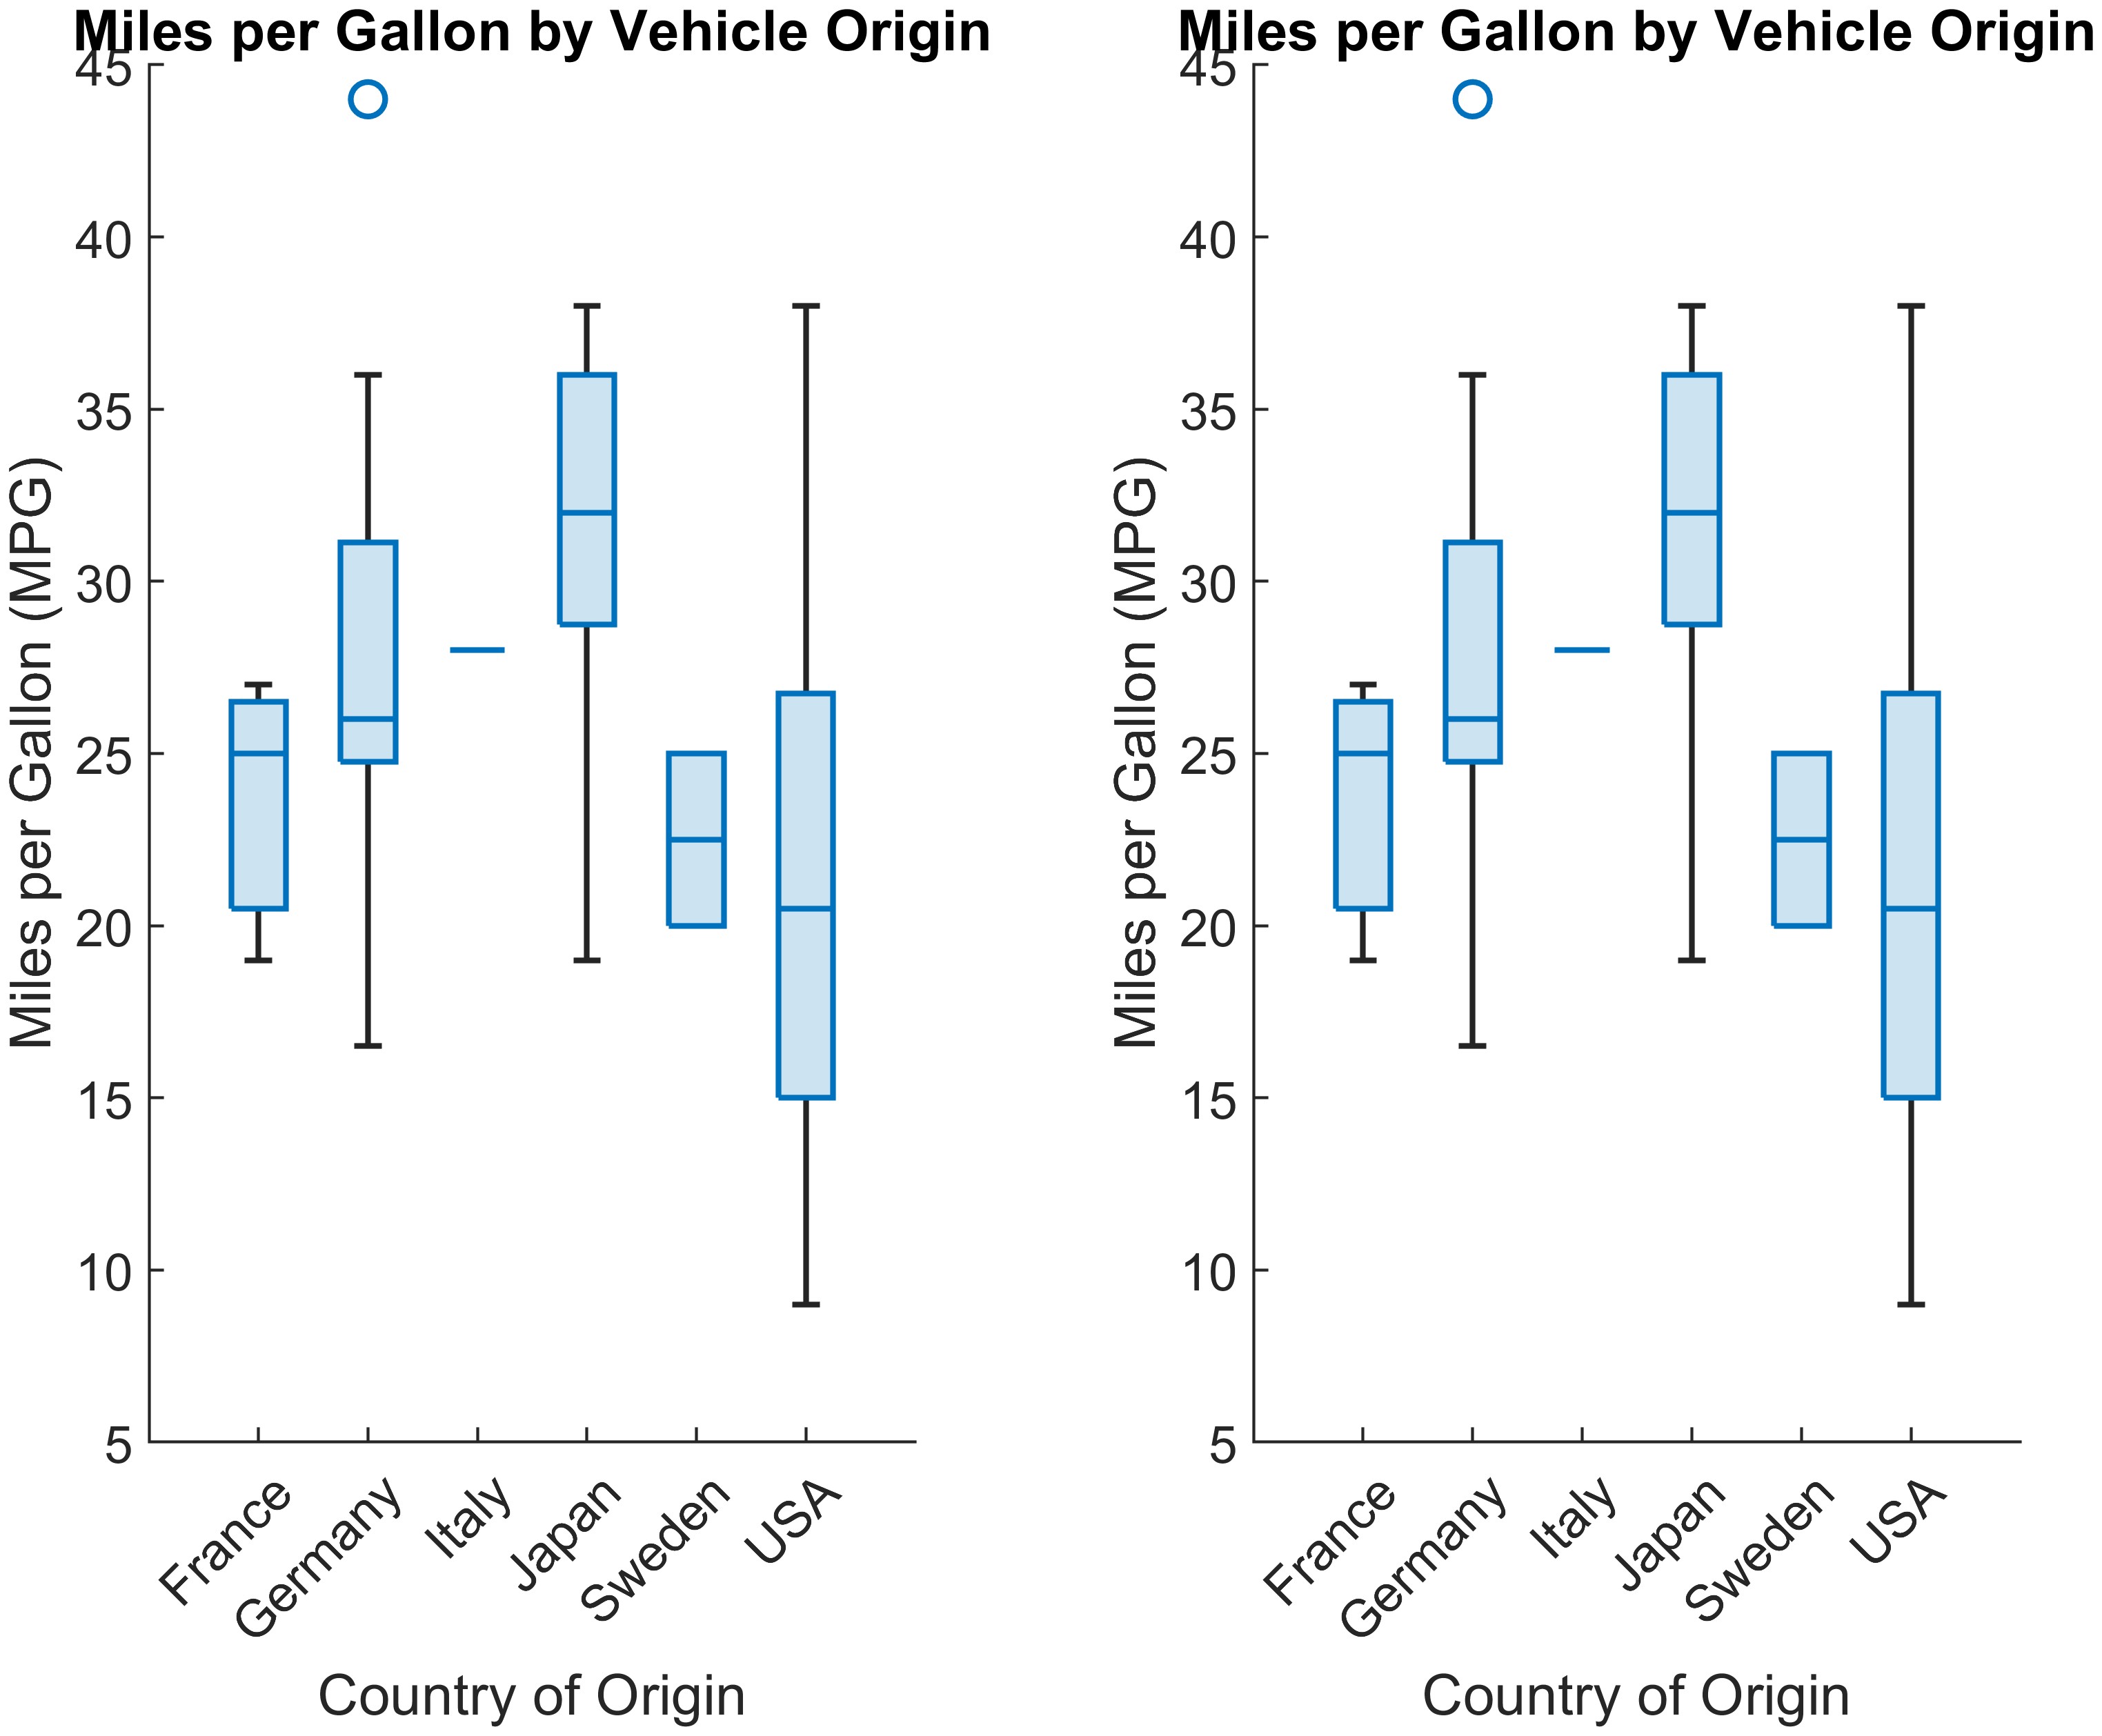
At this time, the warning didn’t appear! (NOTE: the use of boxplot and boxchart is sort of different. First, as can be seen from the code, we need to convert the char array to a categorical array; second, for boxplot, first data MPG then group name Origin, whereas for boxchart adopts the reversed order.)
So, it must be a compatibility issue. To verify this point, I checked the “Version History” part of these four functions’ documentation, and found:
boxplot1: “Introduced before R2006a”subplot4: “Introduced before R2006a”boxchart6: “Introduced in R2020a”tiledlayout2: “R2019b: Recommended over subplot:tiledlayoutcreates layouts that are more customizable and configurable than the layouts created bysubplot. For example, you can create layouts with adjustable tile spacing, tiles that reflow according to the size of the figure, and better placed colorbars and legends.”
So, I guess, boxplot and subplot belong to the old graphics system, whereas boxchart and tiledlayout belong to the new one — maybe based on very different internal graphic classes and functions. Make sense anyway.
boxchart vs. boxplot
So, both boxchart and boxplot are used to generate a box plot, but as can be seen from above examples (or look through those examples on the documentation), we can find, boxplot’s results are “old-fashioned” and boxchart’s look more modern. Because in the past I always use boxplot and this is my first time to know boxchart6, so I select two examples from the boxchart documentation to learn, shown as follows.
(1) Update Color of BoxChart Object
1
2
3
4
5
6
7
8
9
10
11
12
13
14
15
clc, clear, close all

load patients
Gender = categorical(Gender);
Smoker = categorical(Smoker,logical([1 0]),{'Smoker','Nonsmoker'});

cgroupdata = Gender.*Smoker;
b = boxchart(Diastolic,'GroupByColor',cgroupdata);

legend('Location','southeast')

% Update the color of the third box chart by using the SeriesIndex property.
b(3).SeriesIndex = 6;

exportgraphics(gcf, 'fig4.jpg', 'Resolution', 600)
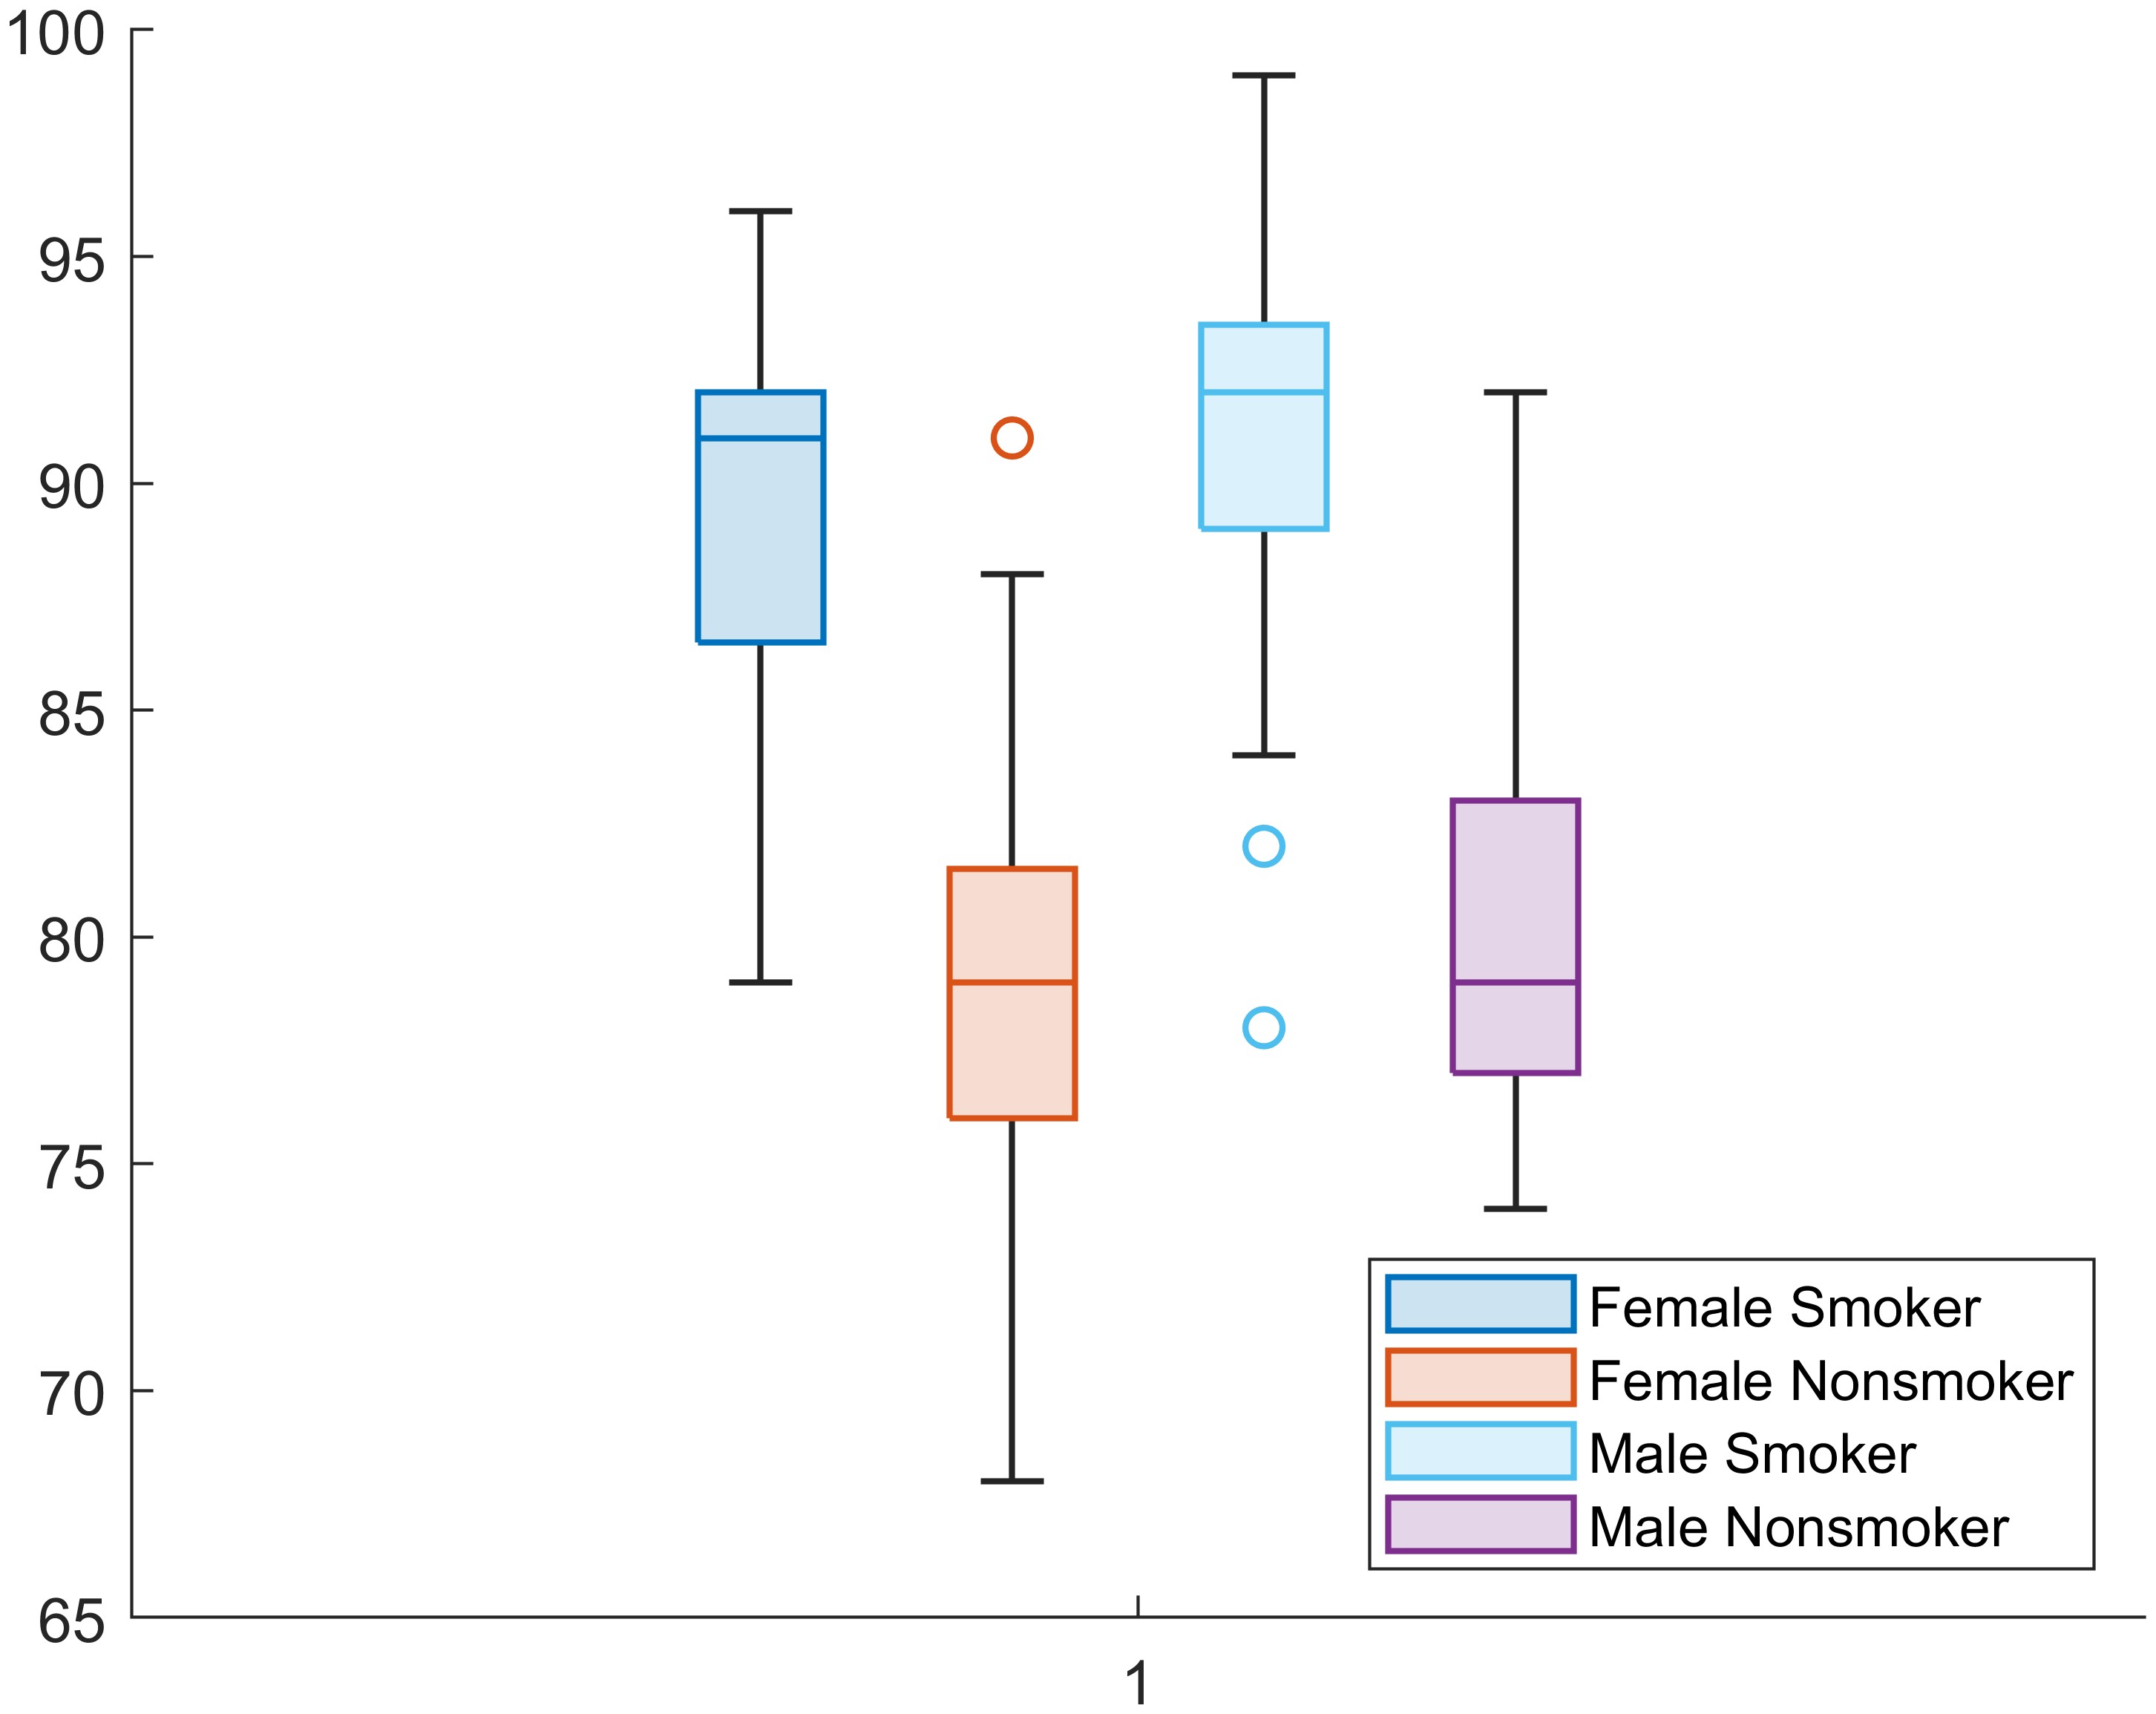
I think the reason why boxchart looks more modern, compared with boxplot, is that it can always fill the box body using color and adopt beautiful color matching to distinguish body and border, but old-fashioned boxplot doesn’t (maybe hence save money when printing papers in the past).
(2) Visualize and Find Outliers
1
2
3
4
5
6
7
8
9
10
11
clc, clear, close all

outages = readtable('outages.csv');

b = boxchart(outages.Customers);
ylabel('Number of Customers')

b.JitterOutliers = 'on';
b.MarkerStyle = '.';

exportgraphics(gcf, 'fig5.jpg', 'Resolution', 600)
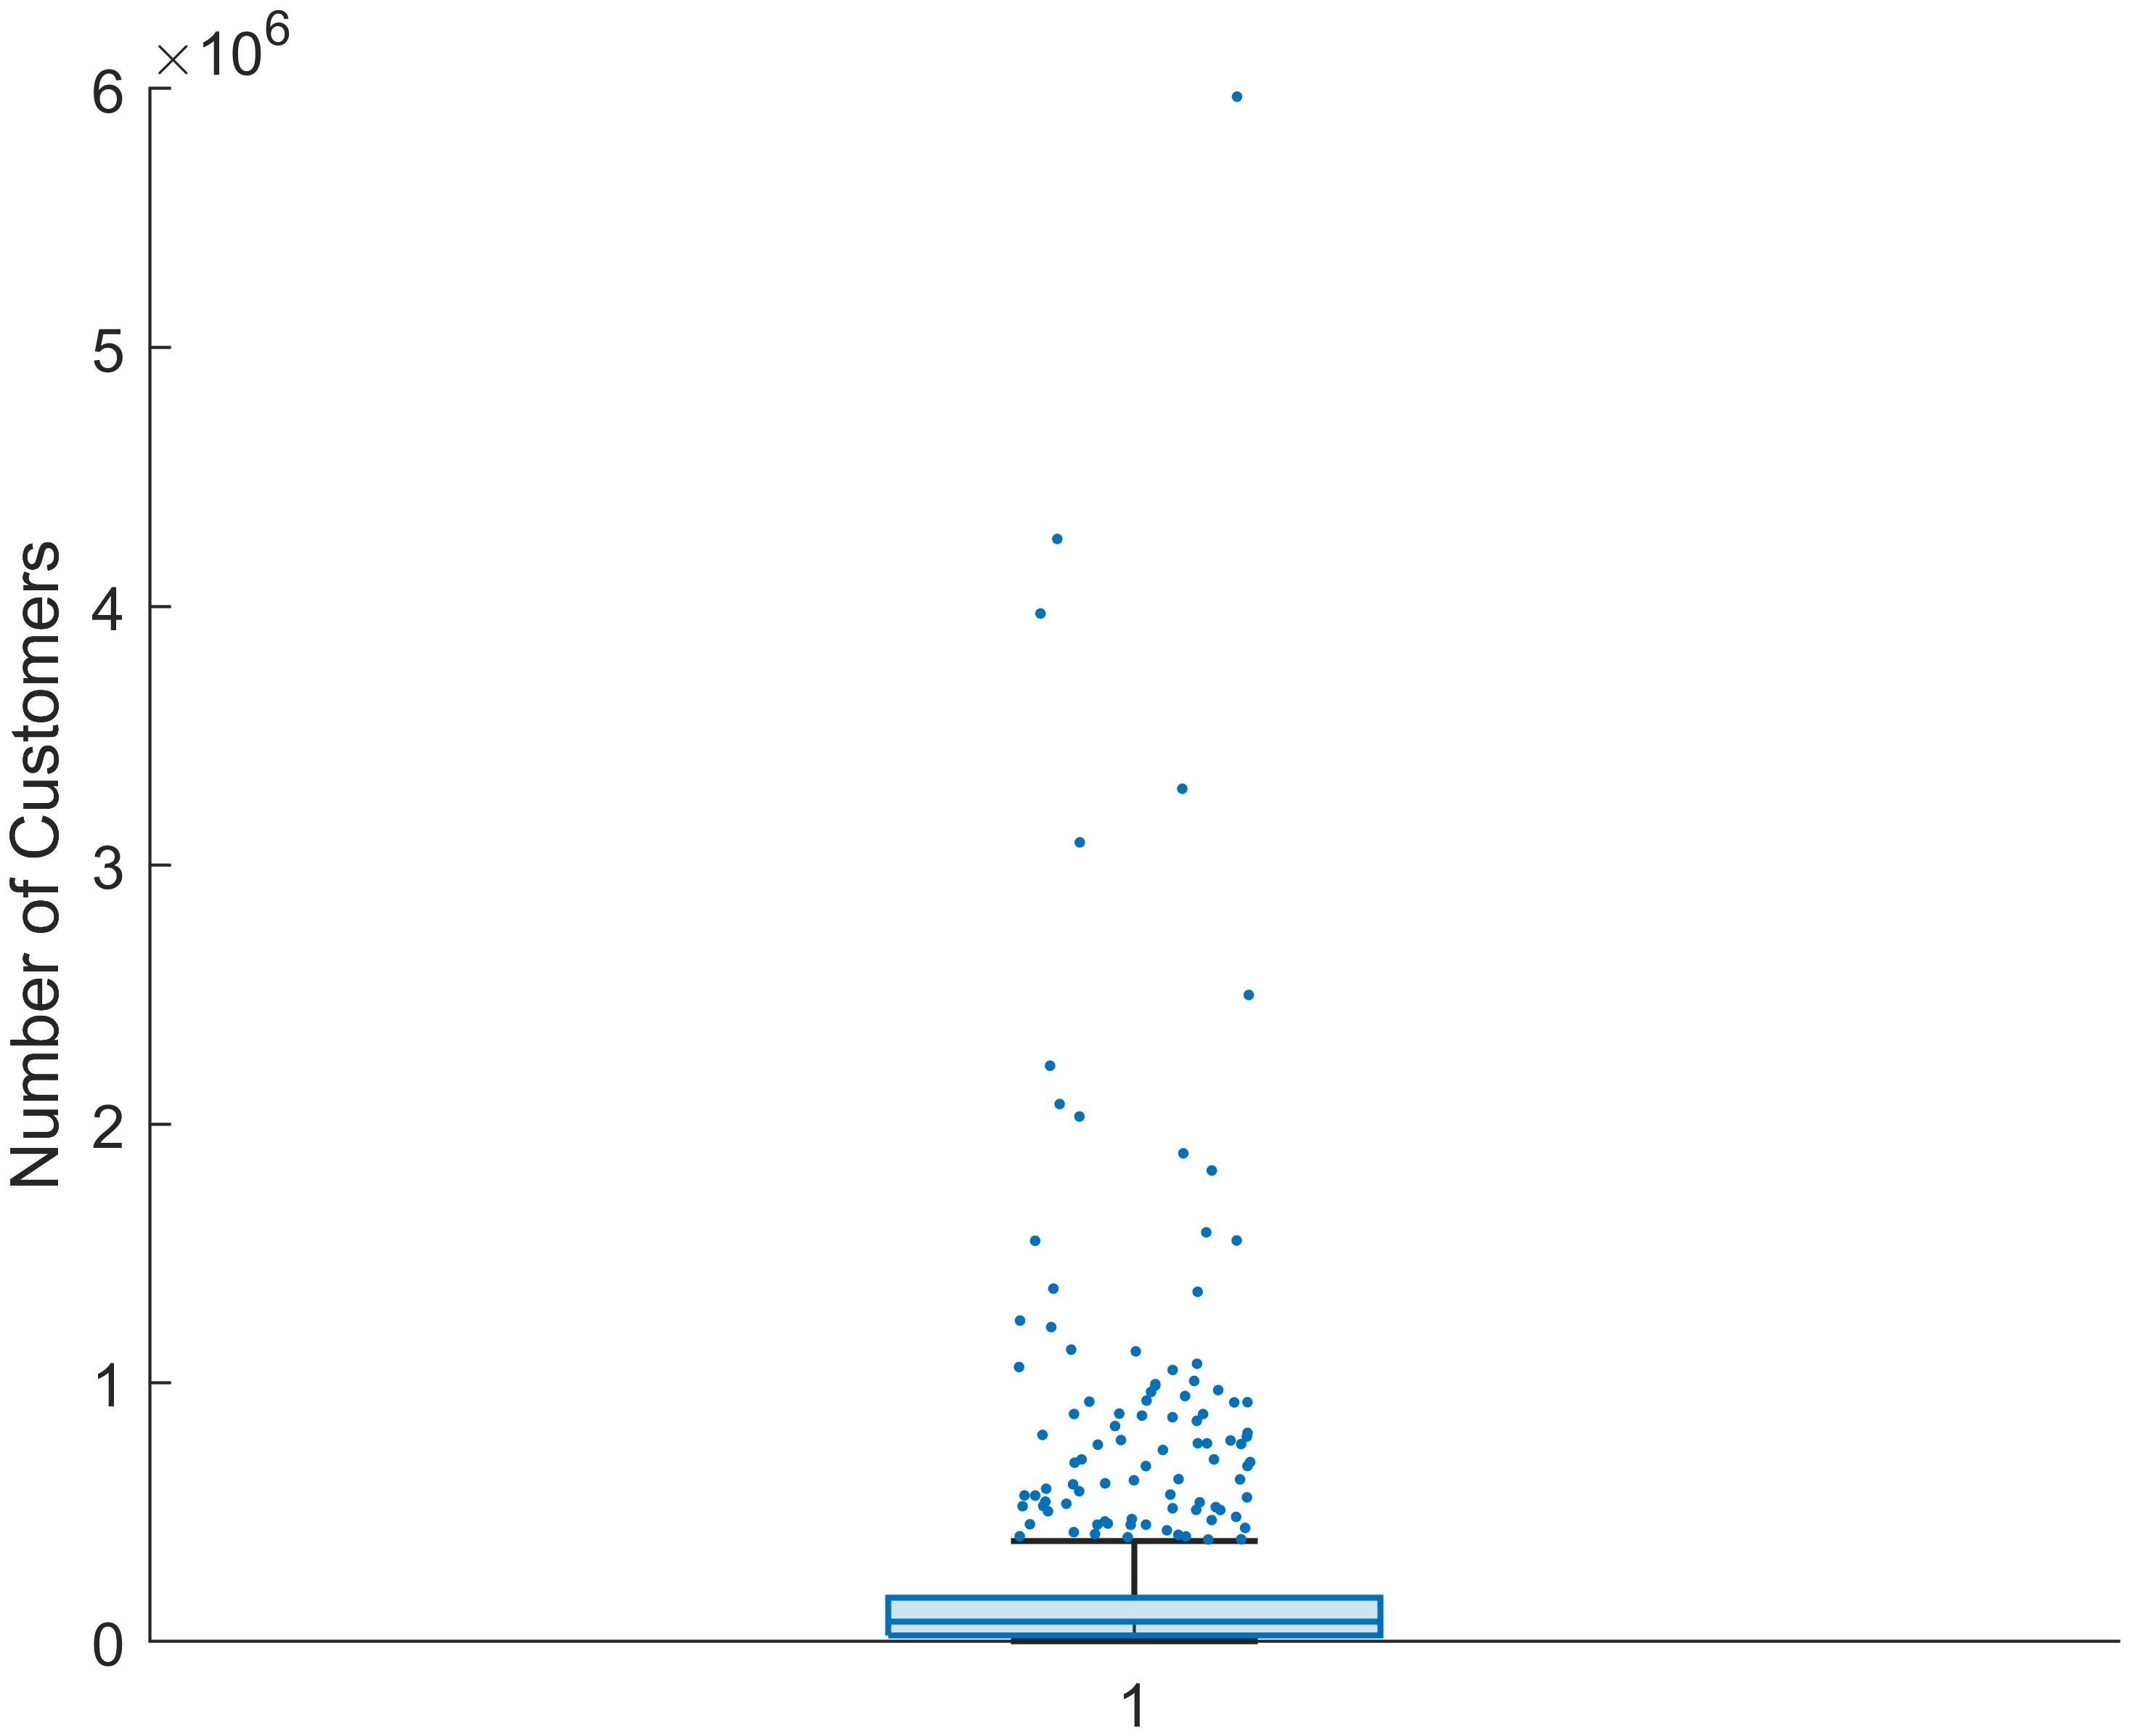
This example shows how to use the property JitterOutliers of BoxChart to create jittered outliers to realize a better visualization. It instantly reminds me of another Python example, “Palmer Penguins exploration with violinplots in Matplotlib”7, which adds some jitters, from a t-distribution, on the x-position of all data points to avoid them totally overlapped. However, the MATLAB boxchart function seems not support adding jitters for all points (only for those outliers, cause by default it only displays outliers).
References