Visualize Sparsity Pattern of A Matrix by MATLAB spy Function
Jul. 11, 2025 • Updated Jul. 11, 2025
MATLAB spy function is to “visualize sparsity pattern of matrix”1, for example:
1
2
3
4
5
6
clc, clear, close all

[B, ~] = bucky;
spy(B, 'r.', 10)

exportgraphics(gca, "fig.jpg", "Resolution", 600)
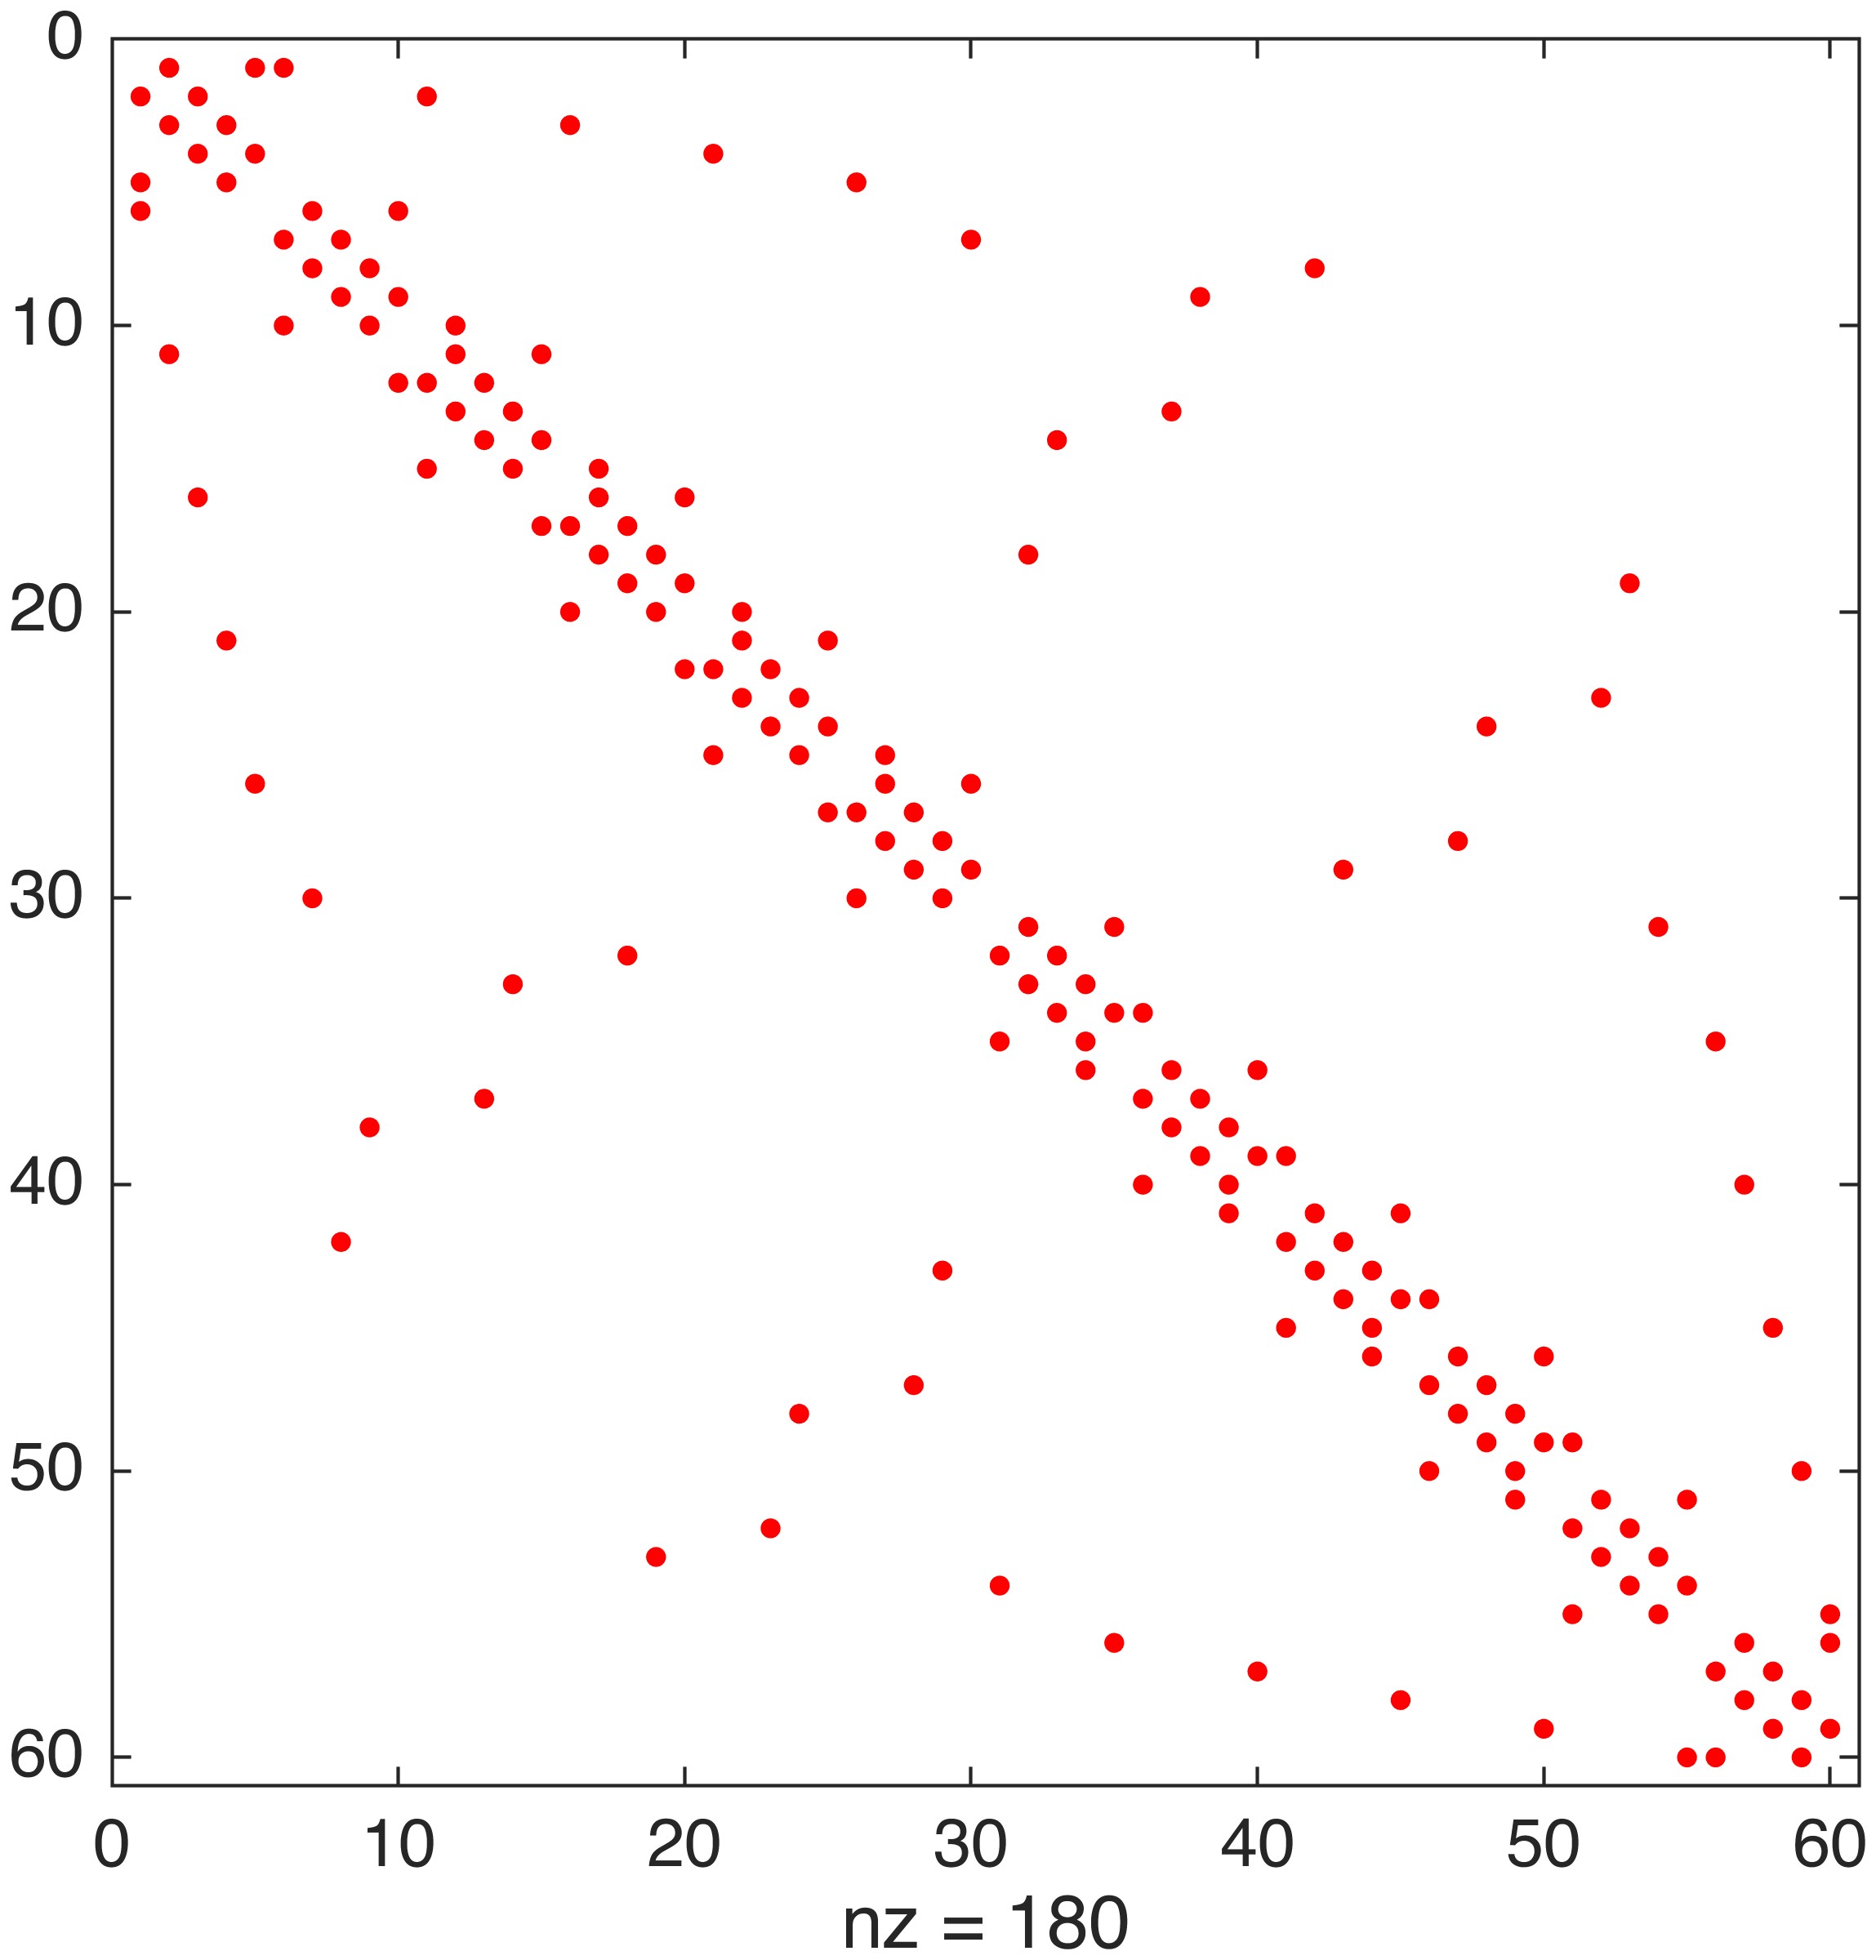
where the bucky function is to generate a bucky ball adjacency matrix, which is a 60-by-60 symmetric sparse matrix with only 180 nonzero elements (the density of this matrix is 5%)2.
Alternatively, I think maybe we can use another function, imagesc, to realize a similar effect (refer to3):
1
2
3
4
5
6
7
clc, clear, close all

[B, ~] = bucky;
imagesc(B)
% colorbar

exportgraphics(gca, "fig.jpg", "Resolution", 600)

Besides, format + is another way, a text-based alternative, to display the nonzero structure of a matrix1:
1
2
3
4
5
6
7
clc, clear, close all

[B, ~] = bucky;
B = full(B);

format +
B
1
2
3
4
5
6
7
8
9
10
11
12
13
14
15
16
17
18
19
20
21
22
23
24
25
26
27
28
29
30
31
32
33
34
35
36
37
38
39
40
41
42
43
44
45
46
47
48
49
50
51
52
53
54
55
56
57
58
59
60
 +  ++
+ +       +
 + +           +
  + +               +
+  +                     +
+     +  +
     + +                     +
      + +                                +
       + +                           +
     +  +  +
 +         +  +
         ++ +
           + +                      +
            + +                 +
          +  +  +
  +             +  +
              ++ +
                + +            +
                 + +                                +
               +  +  +
   +                 +  +
                   ++ +
                     + +                           +
                      + +                      +
                    +  +  +
    +                     +  +
                        ++ +
                          + +                 +
                           + +            +
      +                  +  +
                               +  +                  +
                 +            + +
             +                 + +
                                + ++
                              +  +                     +
                                 +  +  +
            +                      + +
        +                           + +
                                     + ++
                                   +  +                 +
                                      +  +  +
       +                                + +
                            +            + +
                                          + ++
                                        +  +             +
                                           +  +  +
                           +                 + +
                       +                      + +
                                               + ++
                                             +  +         +
                                                +  +  +
                      +                           + +
                  +                                + +
                              +                     + +
                                                  +  +     +
                                  +                     +  +
                                       +               + +
                                            +           + +
                                                 +       + +
                                                      ++  +
References