Color the Table in LaTeX Using xcolor Package, tabularray Package, and TikZ
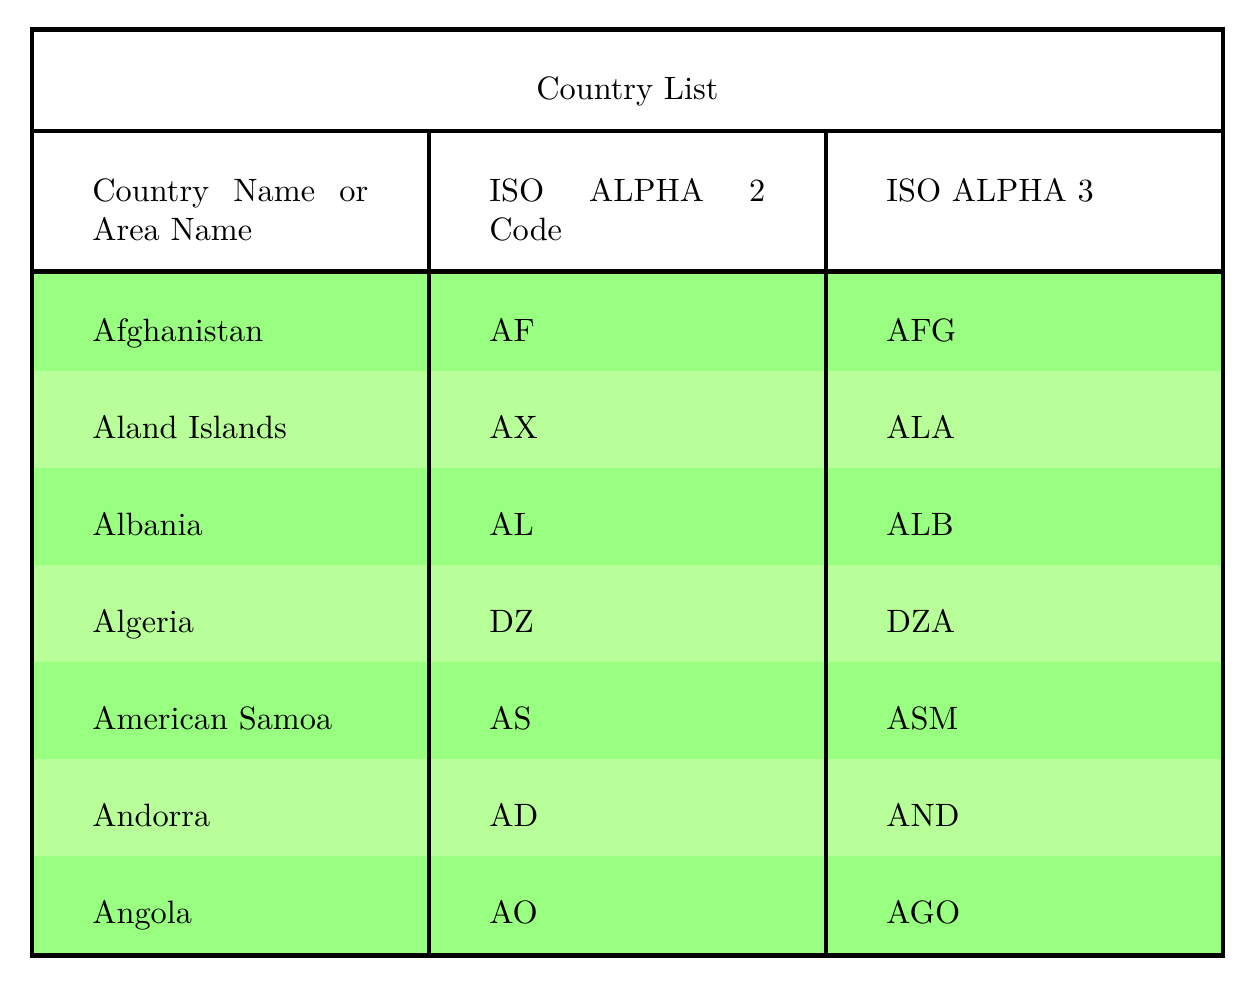
Color the table using xcolor package
Example 11:
1
2
3
4
5
6
7
8
9
10
11
12
13
14
15
16
17
18
19
20
21
22
23
24
25
\documentclass[a4paper]{article}
\usepackage[table]{xcolor}
\pagestyle{empty}

\setlength{\arrayrulewidth}{0.5mm}
\setlength{\tabcolsep}{18pt}
\renewcommand{\arraystretch}{2.5}

\begin{document}
{\rowcolors{3}{green!80!yellow!50}{green!70!yellow!40}
\begin{tabular}{|p{3cm}|p{3cm}|p{3cm}|}
	\hline
	\multicolumn{3}{|c|}{Country List} \\
	\hline
	Country Name or Area Name & ISO ALPHA 2 Code & ISO ALPHA 3 \\
	\hline
	Afghanistan & AF & AFG \\
	Aland Islands & AX & ALA \\
	Albania & AL & ALB \\
	Algeria & DZ & DZA \\
	American Samoa & AS & ASM \\
	Andorra & AD & AND   \\
	Angola & AO & AGO \\ \hline
\end{tabular}}
\end{document}
where1:
Notice the braces right before the command \rowcolors{3}{green!80!yellow!50}{green!70!yellow!40} and after the tabular environment. The command \rowcolors takes three parameters each passed inside braces:
- the row to start,
- the colour for odd rows and
- the colour for even rows.
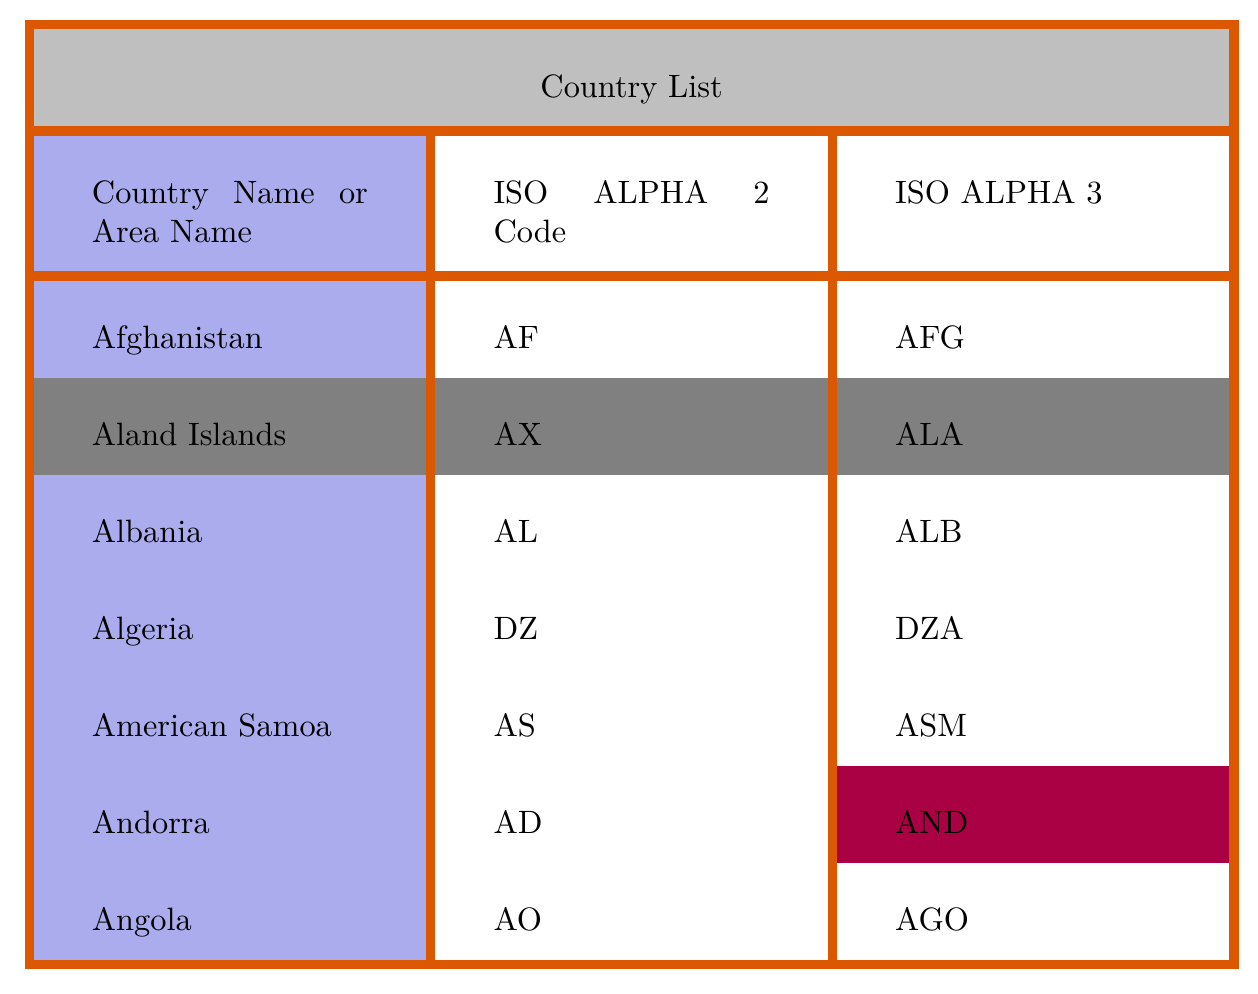
Example 21:
1
2
3
4
5
6
7
8
9
10
11
12
13
14
15
16
17
18
19
20
21
22
23
24
25
26
27
\documentclass[a4paper]{article}
\usepackage[table]{xcolor}
\pagestyle{empty}

\setlength{\arrayrulewidth}{1mm}
\setlength{\tabcolsep}{18pt}
\renewcommand{\arraystretch}{2.5}
\newcolumntype{s}{>{\columncolor[HTML]{AAACED}} p{3cm}}
\arrayrulecolor[HTML]{DB5800}

\begin{document}
\begin{tabular}{|s|p{3cm}|p{3cm}|}
	\hline
	\rowcolor{lightgray} \multicolumn{3}{|c|}{Country List} \\
	\hline
	Country Name or Area Name & ISO ALPHA 2 Code & ISO ALPHA 3 \\
	\hline
	Afghanistan & AF & AFG \\
	\rowcolor{gray}
	Aland Islands & AX & ALA \\
	Albania   & AL & ALB \\
	Algeria  & DZ & DZA \\
	American Samoa & AS & ASM \\
	Andorra & AD & \cellcolor[HTML]{AA0044} AND \\
	Angola & AO & AGO \\ \hline
\end{tabular}
\end{document}
where1:
Below is a description about how to change the colour of each element in the table:
-
Colour of the lines. The command
\arrayrulecoloris used for this. In the example an HTML format is used, but other formats are available too. -
Background colour of a cell. Use the command
\cellcolor. You can either enter the name directly inside the braces (red, gray, green and so on) or pass a format parameter inside brackets (HTML in the example) and then set the desired colour inside the braces using the established format. -
Background colour of a row. In this case
\rowcolorwill accomplish that. The same observations about colour selection mentioned in the two previous commands are valid for this one. -
Background colour of a column. This one is a bit tricky, but the easiest way is to define a new column type. The command
\newcolumntype{s}{>{\columncolor[HTML]{AAACED}} p{3cm}}define a column type calledswhose alignment isp, the column width is3cmand the colour is set with HTML format toAAACED. This new column type is used in thetabularenvironment.
Example 32:
1
2
3
4
5
6
7
8
9
10
11
12
13
14
15
16
17
18
19
20
21
22
23
24
25
26
27
28
29
30
31
\documentclass[a4paper]{article}
\usepackage{amsmath}
\usepackage[table]{xcolor}
\pagestyle{empty}

\newcommand\x{\times}
\newcommand\y{\cellcolor{green!10}}

\begin{document}
\begin{equation*}\label{eq:appendrow}
\left(\begin{array}{cccc}
	\rowcolor{red!20}
	\x & \x & \x & \x \\
	0 & \x & \x & \x \\
	\rowcolor{blue!20}
	0 & 0 & \x & \x \\
	0 & 0 & 0 & \x \\
	\y a & b & \y c & d\\
	\end{array}\right)
\end{equation*}

\begin{equation*}
\left(\begin{array}{>{\columncolor{olive!20}}cc>{\columncolor{yellow!20}}cc}
	\x & \x & \x & \x \\
	0 & \x & \x & \x \\
	0 & 0 & \x & \x \\
	0 & 0 & 0 & \x \\
	a & b & c & d \\
\end{array}\right)
\end{equation*}
\end{document}
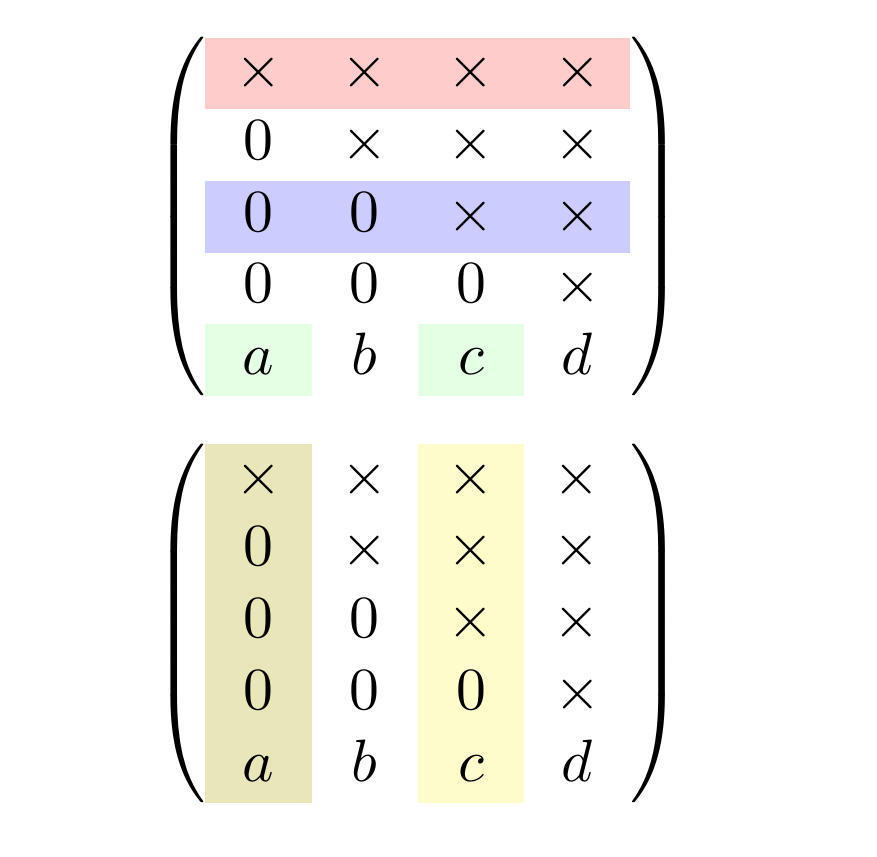
Color the table using tabularray package
Example 13:
1
2
3
4
5
6
7
8
9
10
11
12
13
14
15
16
17
18
19
20
21
22
23
24
25
26
27
28
29
30
31
32
33
34
\documentclass{article}
\usepackage{amsmath}
\usepackage{xcolor}
\usepackage{tabularray}
\SetTblrInner{colsep=5pt,rowsep=1pt}
\newcommand\x{\times}

\begin{document}

\begin{equation*}\label{eq:appendrow}
\left(\begin{tblr}{
	colspec = {cccc},
	row{1} = {red9},
	row{3} = {blue9},
	cell{5}{1,3} = {green9},
}
	\x & \x & \x & \x \\
	0 & \x & \x & \x \\
	0 &  0 & \x & \x \\
	0 &  0 &  0 & \x \\
	a &  b &  c &  d \\
\end{tblr}\right)
\end{equation*}

\begin{equation*}
\left(\begin{tblr}{Q[c,olive9]cQ[c,yellow9]c}
	\x & \x & \x & \x \\
	0 & \x & \x & \x \\
	0 &  0 & \x & \x \\
	0 &  0 &  0 & \x \\
	a &  b &  c &  d \\
\end{tblr}\right)
\end{equation*}
\end{document}
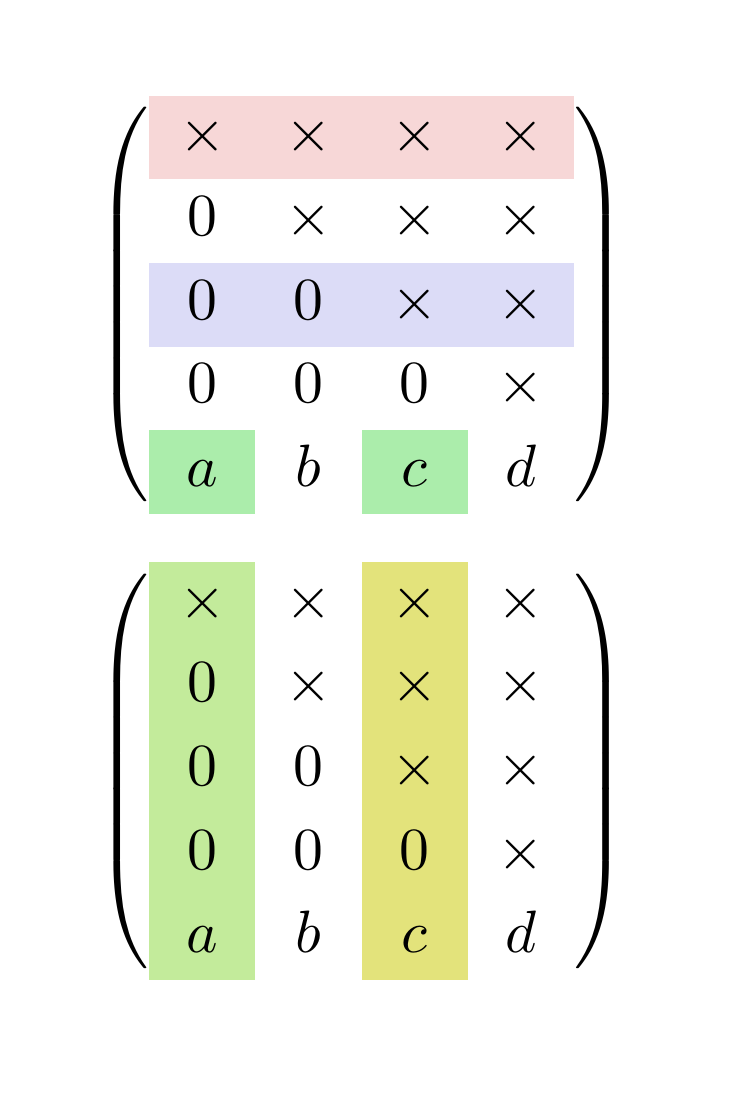
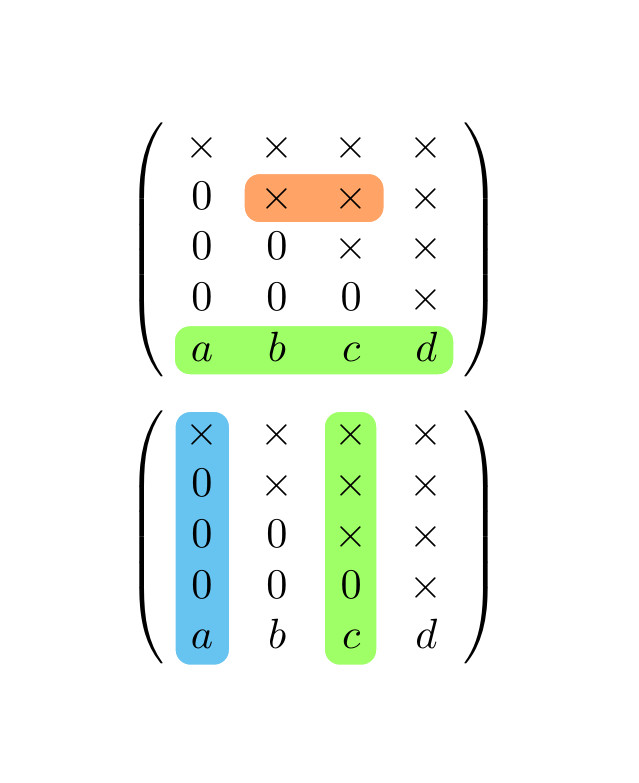
Color the table using TikZ
Example4:
1
2
3
4
5
6
7
8
9
10
11
12
13
14
15
16
17
18
19
20
21
22
23
24
25
26
27
28
29
30
31
32
33
34
35
36
37
38
39
40
41
42
43
44
45
46
47
48
49
50
51
52
53
54
55
\documentclass{article}
\usepackage{amsmath}

\newcommand\x{\times}

% requires version 0.3 of the package
\usepackage[customcolors]{hf-tikz}

\tikzset{style green/.style={
		set fill color=green!50!lime!60,
		set border color=white,
	},
	style cyan/.style={
		set fill color=cyan!90!blue!60,
		set border color=white,
	},
	style orange/.style={
		set fill color=orange!80!red!60,
		set border color=white,
	},
	hor/.style={
		above left offset={-0.15,0.31},
		below right offset={0.15,-0.125},
		#1
	},
	ver/.style={
		above left offset={-0.1,0.3},
		below right offset={0.15,-0.15},
		#1
	}
}

\begin{document}

\begin{equation*}\label{eq:appendrow}
\left(\begin{array}{cccc}
	\x  & \x  & \x & \x \\
	0   & \tikzmarkin[hor=style orange]{el} \x  & \x\tikzmarkend{el} & \x \\
	0   & 0   & \x & \x \\
	0   & 0   & 0  & \x \\
	\tikzmarkin[hor=style green]{row} a  &  b  &  c &  d \tikzmarkend{row}\\
\end{array}\right)
\end{equation*}

\begin{equation*}\label{eq:appendcol}
\left(\begin{array}{cccc}
	\tikzmarkin[ver=style cyan]{col 1}\x  & \x  & \tikzmarkin[ver=style green]{col 2} \x & \x \\
	0   & \x  & \x & \x \\
	0   & 0   & \x & \x \\
	0   & 0   & 0  & \x \\
	a \tikzmarkend{col 1}  &  b  &  c  \tikzmarkend{col 2} &  d \\
\end{array}\right)
\end{equation*}

\end{document}
1
2
3
4
5
6
7
8
9
10
11
12
13
14
15
16
17
18
19
20
21
22
23
24
25
26
27
28
29
30
31
32
33
34
35
36
37
38
39
40
41
42
43
44
45
46
47
48
49
50
51
52
53
54
55
56
57
58
59
60
61
62
63
64
65
66
67
68
69
70
71
72
73
74
75
76
77
78
79
80
81
82
83
84
85
86
87
88
89
90
91
92
93
94
95
96
\documentclass{article}
\usepackage{tikz}
\usetikzlibrary{matrix,fit}
\usetikzlibrary{backgrounds}
\newcommand\x{\times}

\begin{document}
\hfill
\begin{tikzpicture}
\matrix[matrix of math nodes,
		row sep=.5ex,
		column sep=.5ex,
		left delimiter=(,right delimiter=),
		nodes={text width=.75em, text height=1.75ex, text depth=.5ex, align=center}
		](m)
	{
		\x & \x & \x & \x \\
		0  & \x & \x & \x \\
		0  & 0  & \x & \x \\
		0  & 0  & 0  & \x \\
		1  & 1  & 1  & 1 \\
	};
\begin{scope}[on background layer]
	\node[fit=(m-2-1)(m-2-4), draw=green!30, fill=green!30, rounded corners] {};
	\node[fit=(m-1-3)(m-5-3), draw=green!30, fill=green!30, rounded corners] {};
	\node[fit=(m-2-3), fill=green] {};
\end{scope}
\end{tikzpicture}
\hfill
\begin{tikzpicture}
\matrix[matrix of math nodes,
			nodes={rectangle, minimum size=1.2em, text depth=0.25ex,
			inner sep=0pt, outer sep=0pt,
			anchor=center},
		column sep=-0.5\pgflinewidth,
		row sep=-0.5\pgflinewidth,
		inner sep=0pt,
		left delimiter=(, right delimiter=),
		row 2 column 2/.append style={nodes={draw=cyan,fill=cyan}},
		](m)
	{
		a_1 & \x & a_3 \\
		a_4 & \x & a_6 \\
		a_7 & \x & a_9 \\
	};
\begin{scope}[on background layer]
	\filldraw[cyan!50, rounded corners] (m-2-1.north west) --
		(m-2-1.south west) -- (m-2-3.south east)-- (m-2-3.north east)-- cycle;
	\filldraw[cyan!50, rounded corners] (m-1-2.north west) --
		(m-3-2.south west) -- (m-3-2.south east)-- (m-1-2.north east)-- cycle;
\end{scope}
\end{tikzpicture}
\vspace{3em}

\hfill
\begin{tikzpicture}
\matrix[matrix of math nodes,
		nodes={rectangle, %draw, very thin,
			minimum size=1.2em, text depth=0.25ex,
			inner sep=0pt, outer sep=0pt,
			fill opacity=0.5, text opacity=1,
			anchor=center},
		column sep=-0.5\pgflinewidth,
		row sep=-0.5\pgflinewidth,
		column 2/.append style = {nodes={fill=cyan!50}},
		row 2/.append style = {nodes={fill=cyan!50}},
		row 2 column 2/.append style={nodes={fill=cyan}},
		inner sep=0pt,
		left delimiter=(, right delimiter=),
		]
	{
		a_1 & \x & a_3 \\
		a_4 & \x & a_6 \\
		a_7 & \x & a_9 \\
	};
\end{tikzpicture}
\hfill
\begin{tikzpicture}
\matrix[matrix of math nodes,
		nodes={rectangle,
			minimum size=1.5em, text depth=0.25ex,
			inner sep=0pt, outer sep=0pt,
			anchor=center},
		row 2/.append style = {nodes={preaction={fill=cyan!30}}},
		column 2/.append style = {nodes={fill=red!60},fill opacity=0.5, text opacity=1},
		inner sep=0pt,
		left delimiter=(, right delimiter=),
		]
	{
		a_1 & \x & a_3 \\
		a_4 & \x & a_6 \\
		a_7 & \x & a_9 \\
	};
\end{tikzpicture}
\hfill
\end{document}

References