The Number of Newborns in China
Aug. 16, 2024 • Updated Nov. 03, 2024
1
2
3
4
5
6
7
8
9
10
11
12
13
14
15
16
17
18
19
20
21
22
23
24
25
26
27
28
29
30
31
32
33
34
35
36
import matplotlib.pyplot as plt
from mpl_toolkits.axes_grid1 import host_subplot
%config InlineBackend.figure_format = 'svg'
import numpy as np
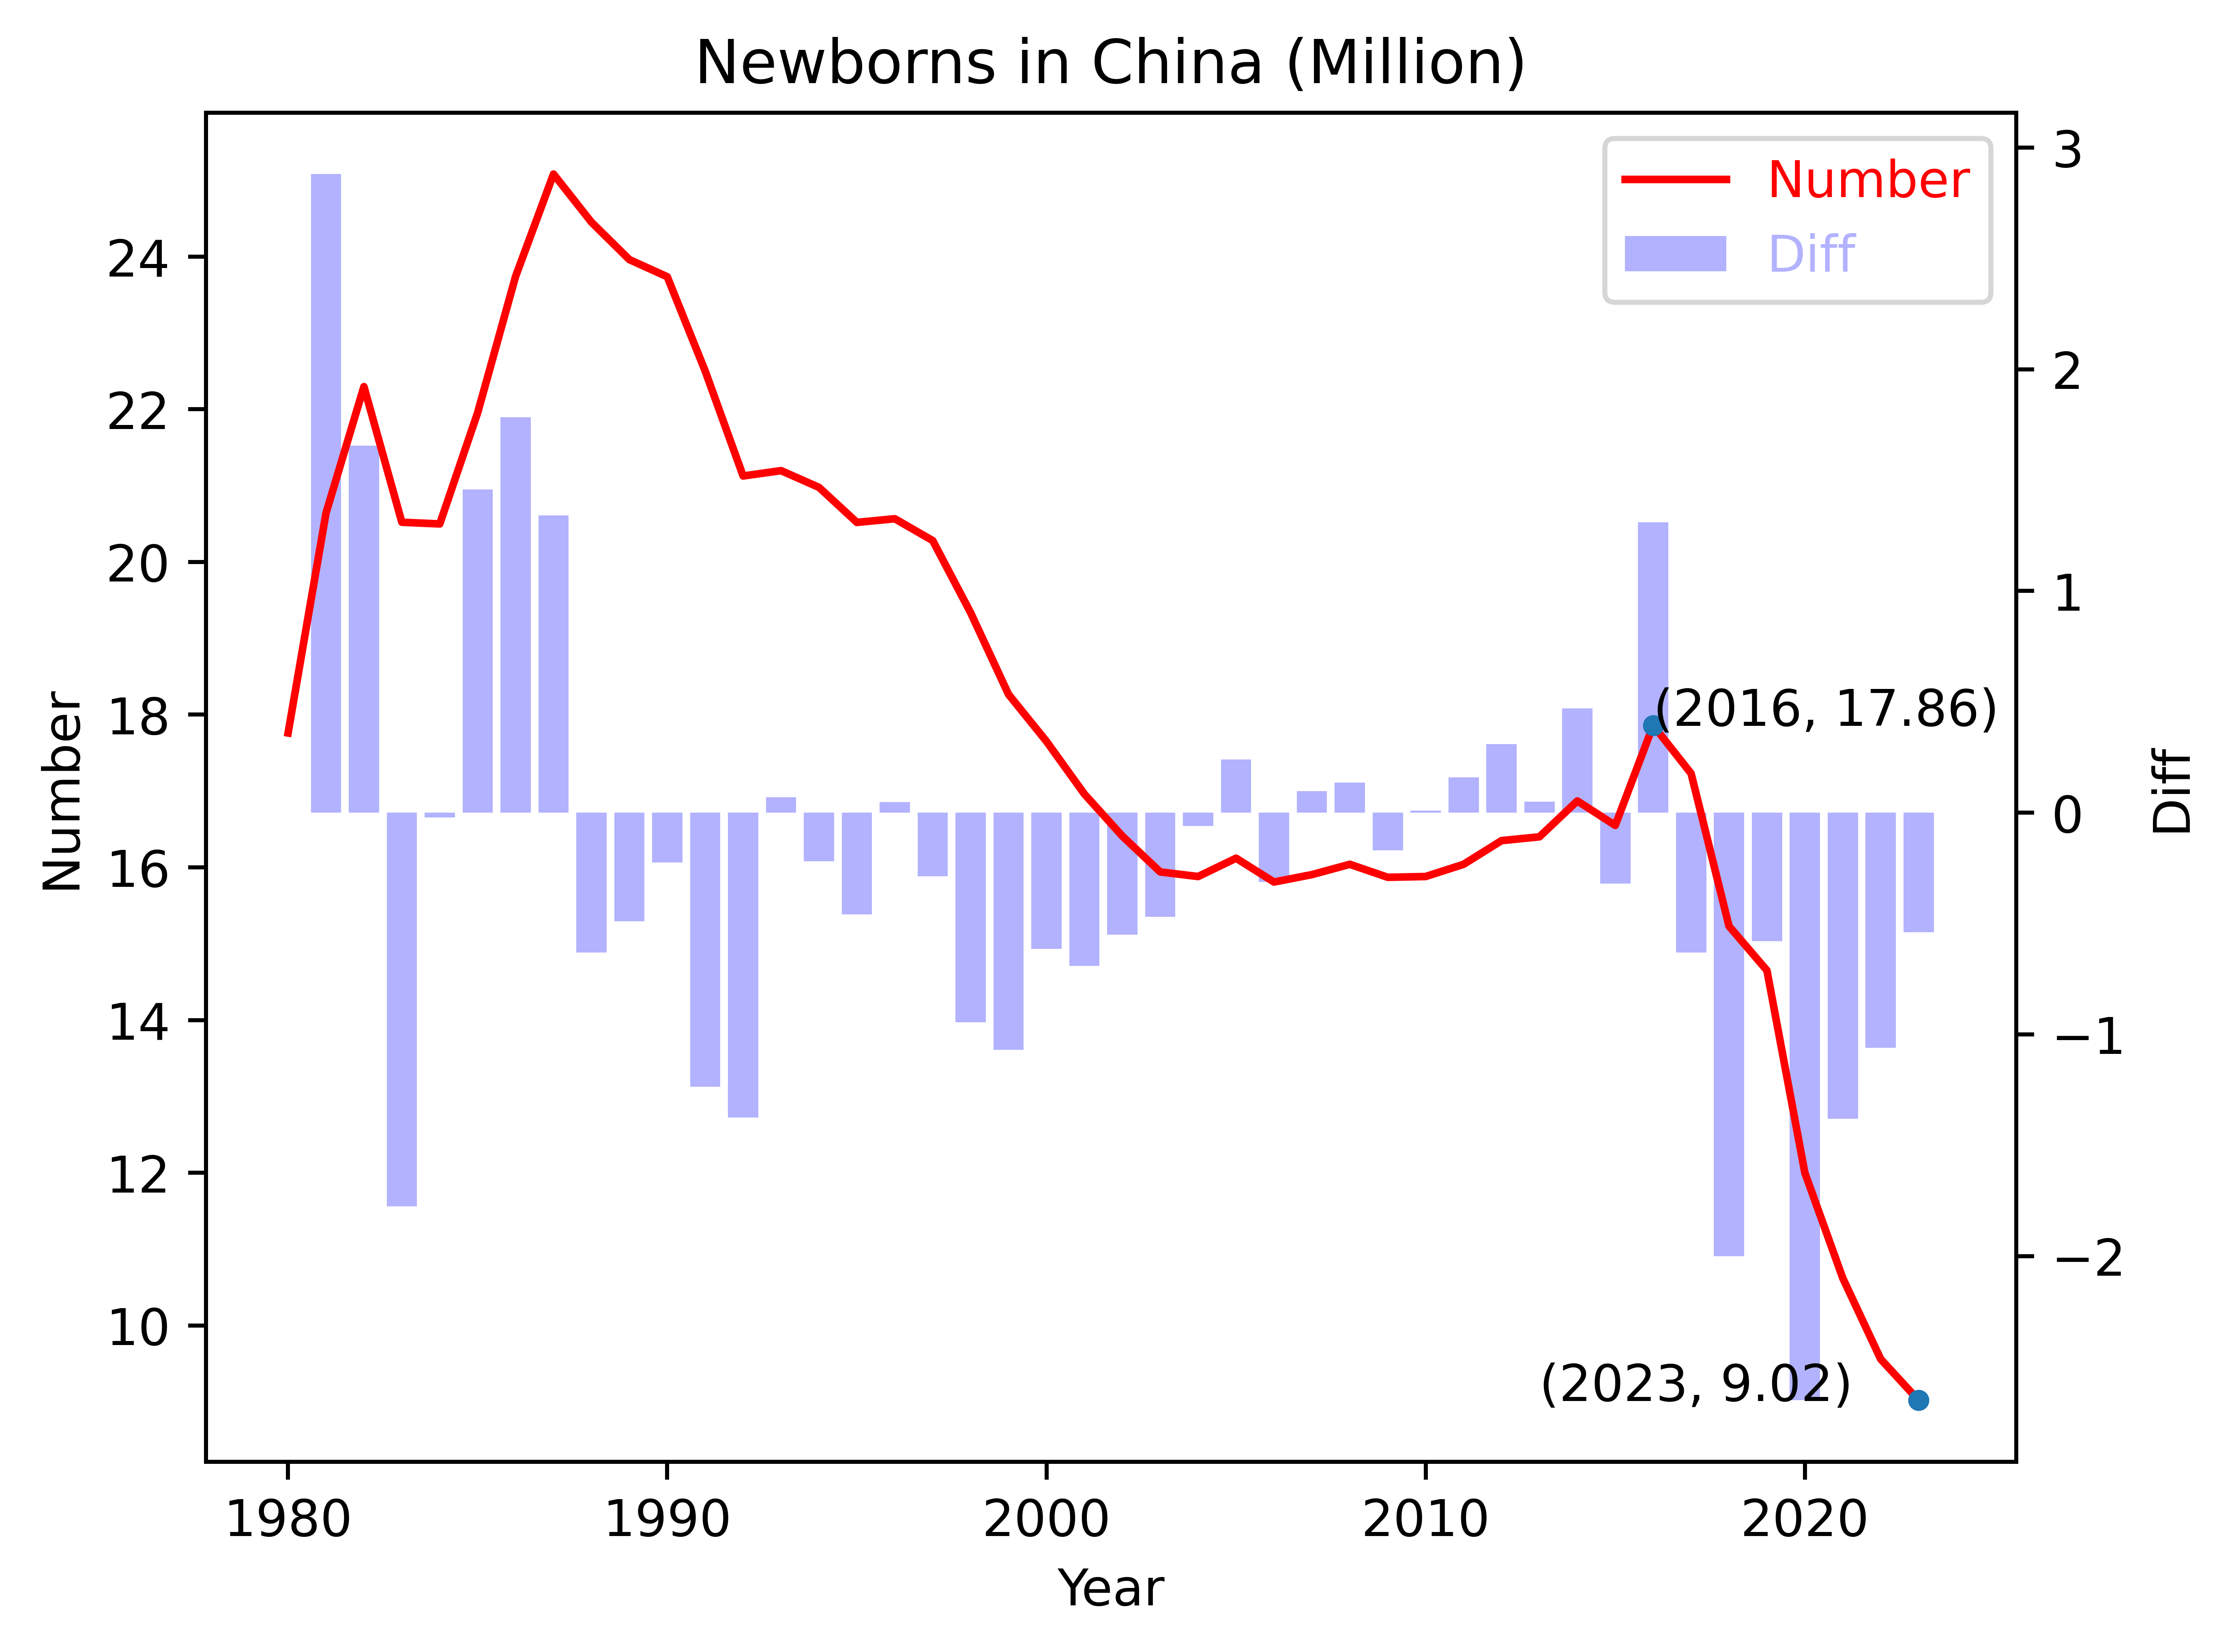
years = np.array(range(1980, 2024))
num = np.array([1776, 2064, 2229.6, 2052, 2049.8,
2195.6, 2374, 2508, 2445, 2396,
2373.5, 2250, 2112.6, 2119.6, 2097.7,
2051.8, 2056.6, 2028, 1933.5, 1826.5,
1765, 1696, 1641, 1594, 1588,
1612, 1580.8, 1590.5, 1604, 1587,
1588, 1604, 1635, 1640, 1687,
1655, 1786, 1723, 1523, 1465,
1200, 1062, 956, 902])/100
num_diff = np.diff(num)
ax1 = host_subplot(111)
ax2 = ax1.twinx()
ax1.plot(years, num, linewidth=1.5, c='r', zorder=2, label='Number')
ax1.scatter([2016, 2023], [17.86, 9.02], zorder=3, s=10)
ax1.text(2016, 17.86, '(2016, 17.86)', fontsize=10)
ax1.text(2013, 9.02, '(2023, 9.02)', fontsize=10)
ax2.bar(years[1::], num_diff, color='blue', alpha=0.3, label='Diff', zorder=1)
ax1.set_xlabel('Year')
ax1.set_ylabel('Number')
ax2.set_ylabel('Diff')
plt.title('Newborns in China (Million)')
ax1.legend(labelcolor="linecolor")
plt.savefig("fig.png", dpi=900, bbox_inches='tight')
plt.show()
References
- 出生人口.