Display Graph and Its Zoom-in Details in the Same MATLAB Figure
Aug. 03, 2024 • Updated Aug. 03, 2024
1
2
3
4
5
6
7
8
9
10
11
12
13
14
15
16
17
18
19
20
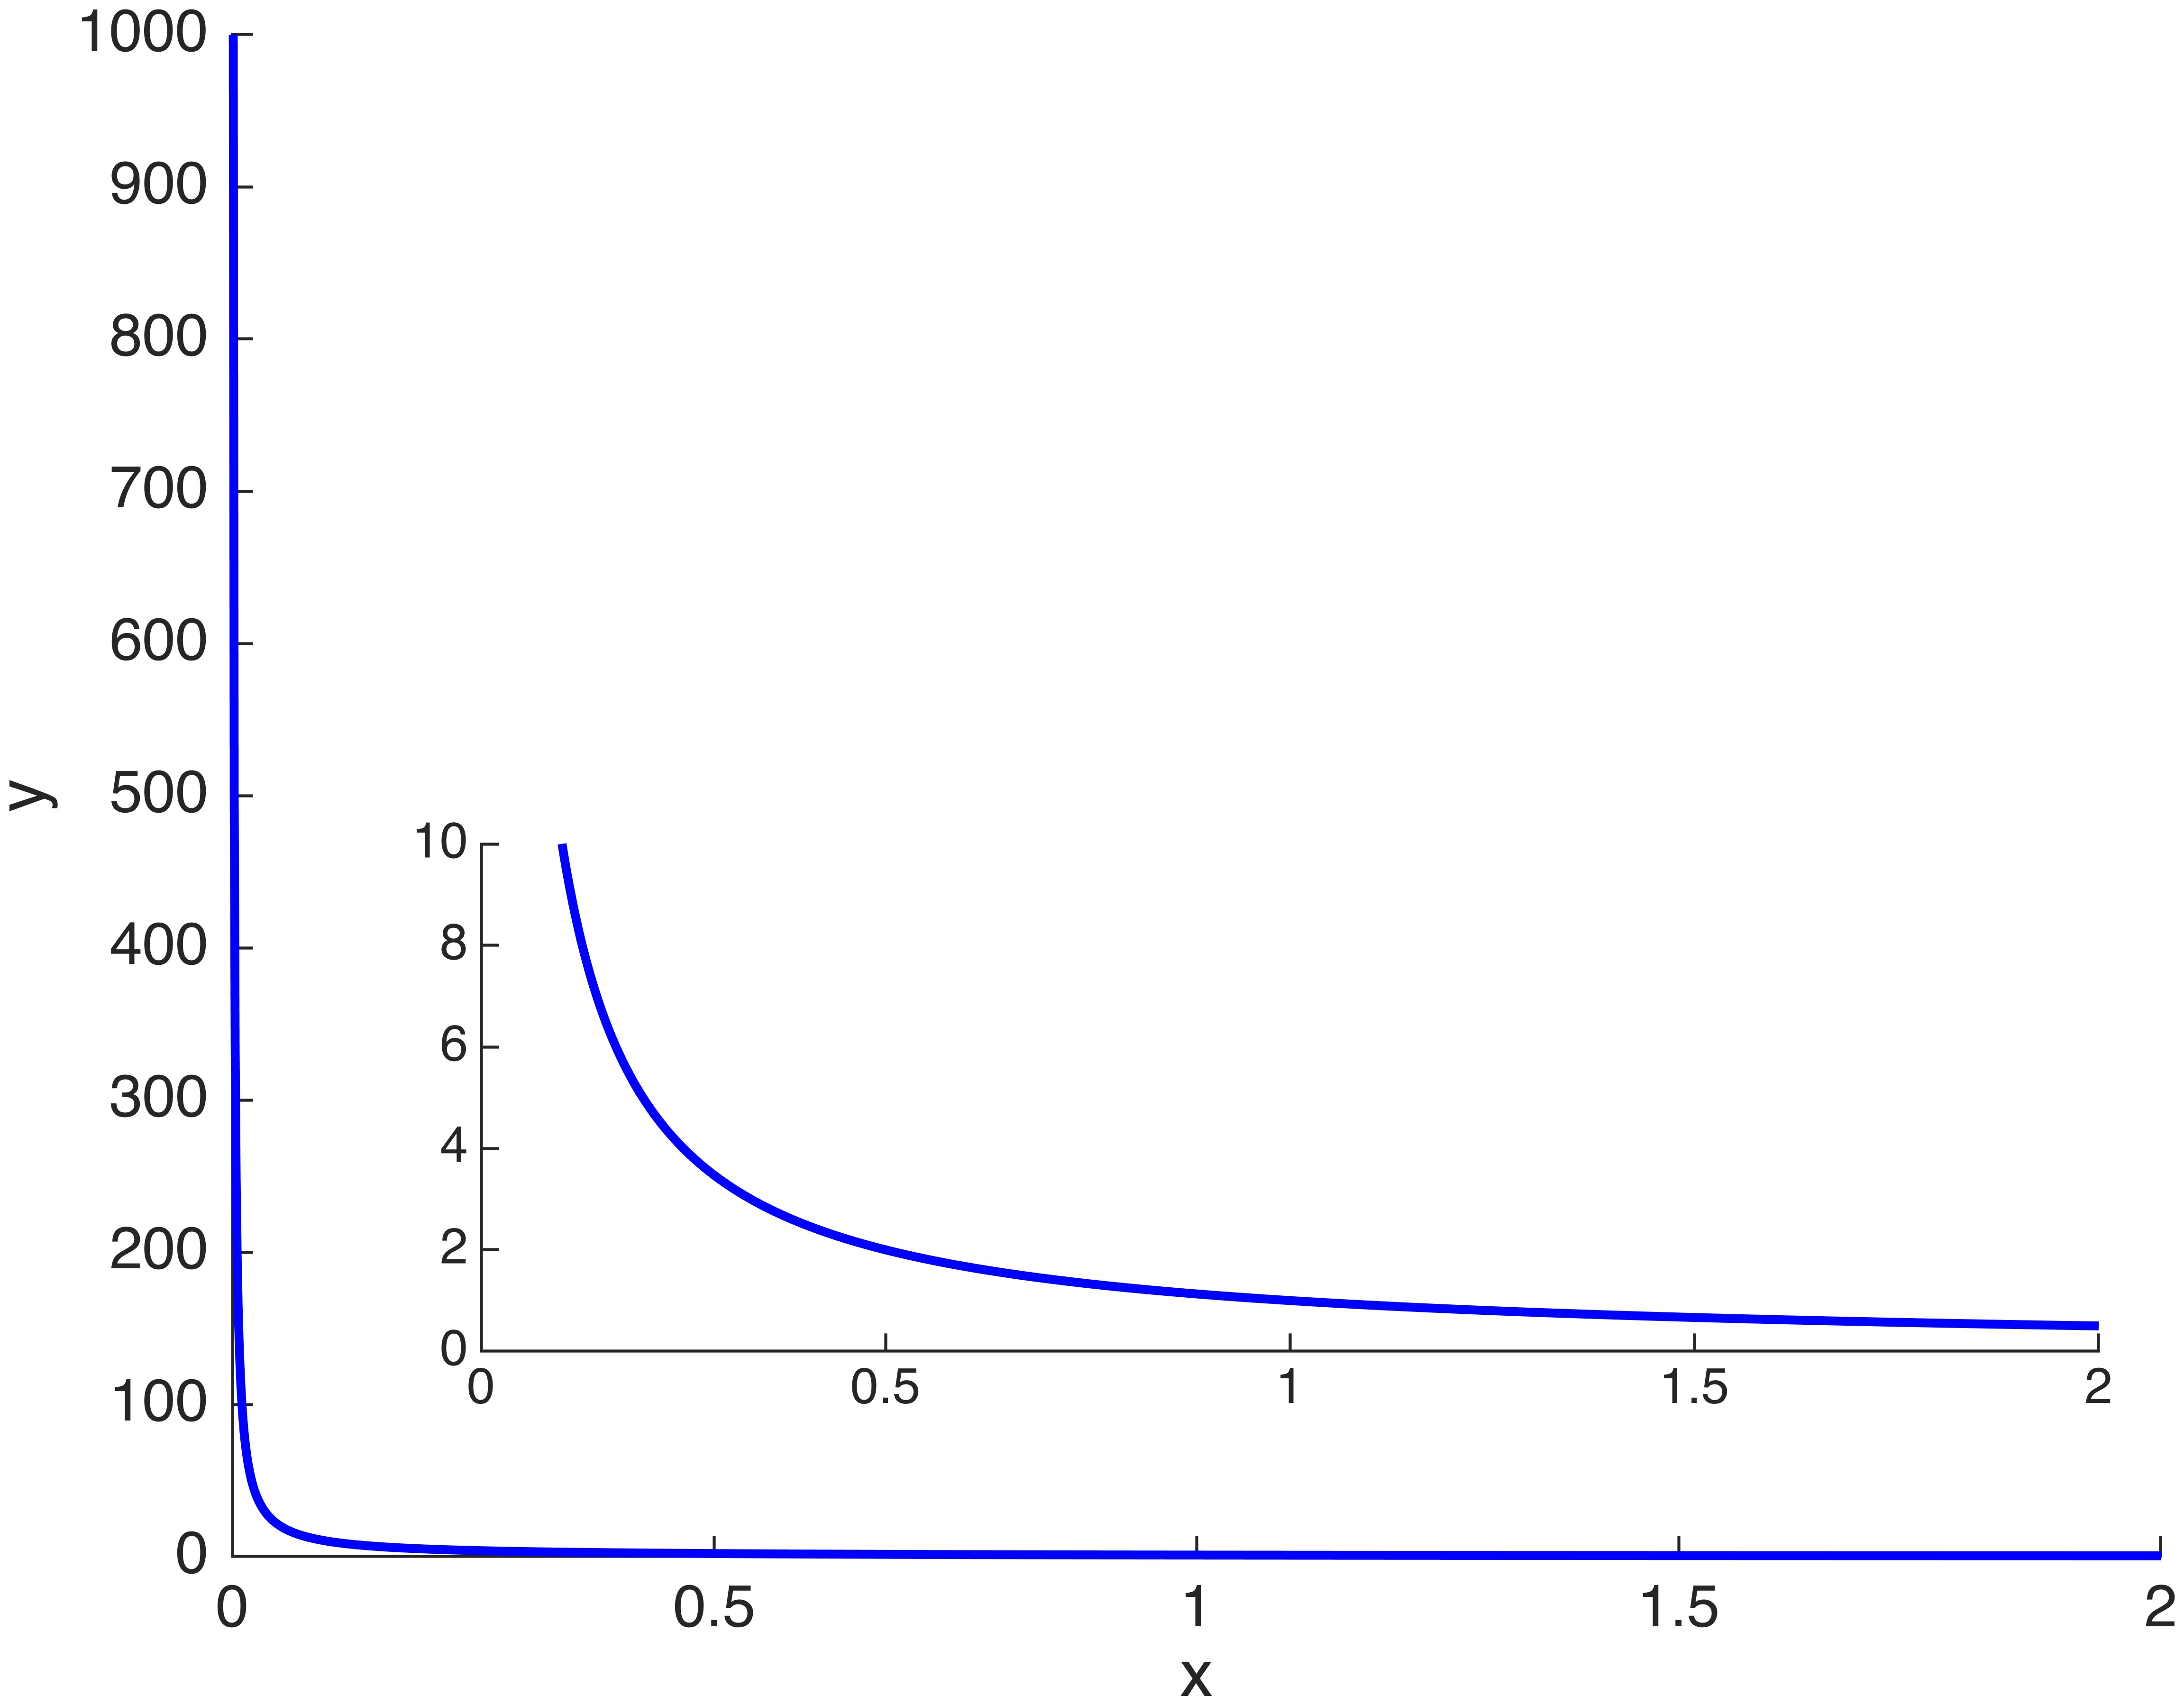
clc, clear, close all
x = 1e-3:1e-3:2;
y = 1./x;
fig = figure("Color","w");
ax = axes;
plot(x, y, "LineWidth", 1.5, "Color", "b")
box(gca, "off")
xlabel("x")
ylabel("y")
copy_of_ax = copyobj(ax, fig);
ax_position = ax.Position;
copy_of_ax.Position = [0.23, ax_position(2)*2, 0.65, ax_position(4)/3];
copy_of_ax.YLim = [0, 10];
copy_of_ax.XLabel = [];
copy_of_ax.YLabel = [];
exportgraphics(fig, "fig.jpg", "Resolution", 900)
References
[1] MATLAB copyobj: Copy graphics objects and their descendants.