Make Diagrams by Mermaid (A Diagramming and Charting Tool) in Typora and Jekyll Website
Introduction
Mermaid is a diagramming and charting tool1:
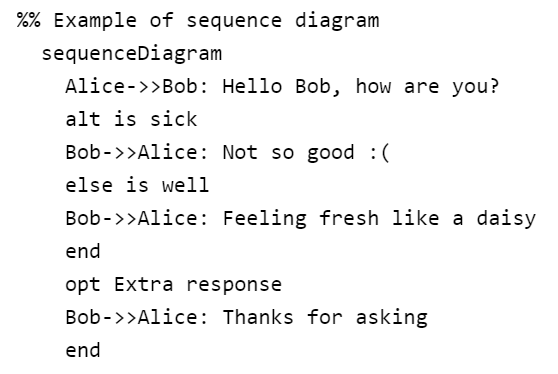
and Markdown editor Typora naturally supported using Mermaid syntax to make diagrams2. Take the first example, Sequence Diagram, on Typora documentation2. If we type the following code snippet in Typora editor:
1
2
3
4
5
6
7
8
9
10
11
12
13
```mermaid
%% Example of sequence diagram
  sequenceDiagram
    Alice->>Bob: Hello Bob, how are you?
    alt is sick
    Bob->>Alice: Not so good :(
    else is well
    Bob->>Alice: Feeling fresh like a daisy
    end
    opt Extra response
    Bob->>Alice: Thanks for asking
    end
```
NOTE: the code for diagramming must be wrapped in fenced code block whose name is mermaid.
%% Example of sequence diagram
  sequenceDiagram
    Alice->>Bob: Hello Bob, how are you?
    alt is sick
    Bob->>Alice: Not so good :(
    else is well
    Bob->>Alice: Feeling fresh like a daisy
    end
    opt Extra response
    Bob->>Alice: Thanks for asking
    end
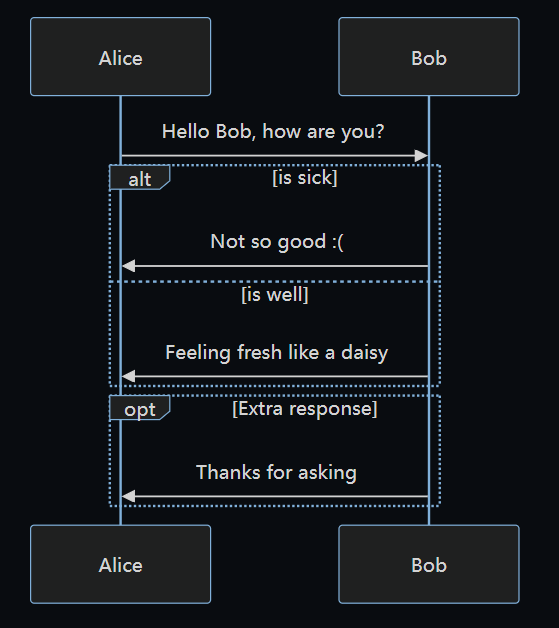
correspondingly, we’ll have a rendered diagram in Typora:
On the other hand, static website generator Jekyll can render Markdown files into webpages, but at this time, it can’t interpret above Mermaid diagramming code well:
To make Mermaid available in webpages, it is a method to add Mermaid JavaScript file by CDN3:
1
2
3
<head>
  <script src="https://cdn.jsdelivr.net/npm/mermaid@10.9.1/dist/mermaid.min.js"></script>
</head>
and then use HTML <div> element to wrap Mermaid code, that is:
1
2
3
4
5
6
7
8
9
10
11
12
13
<div class="mermaid">
    %% Example of sequence diagram
  sequenceDiagram
    Alice->>Bob: Hello Bob, how are you?
    alt is sick
    Bob->>Alice: Not so good :(
    else is well
    Bob->>Alice: Feeling fresh like a daisy
    end
    opt Extra response
    Bob->>Alice: Thanks for asking
    end
</div>
As can be seen, it works. But, Typora can’t render this division with class="mermaid" correctly:

So, my next goal is to find a way to render Mermaid code normally in both Typora editor and Jekyll webpages. It sounds more difficult for me to make Typora correctly interpret those <div> elements with a certain class name, "mermaid" is this case, because to this end I should add some extra configurations for Typora that is installed locally. So, I decided to make browser be able to understand the Mermaid diagramming code in Markdown form well.
I inspect the element rendered by the Markdown code in browser, and find its HTML source code is:
1
2
3
4
5
6
7
8
9
10
11
12
<code class="language-mermaid">%% Example of sequence diagram
sequenceDiagram
Alice->>Bob: Hello Bob, how are you?
alt is sick
Bob->>Alice: Not so good :(
else is well
Bob->>Alice: Feeling fresh like a daisy
end
opt Extra response
Bob->>Alice: Thanks for asking
end
</code>
So, I thought of using JavaScript code to find those <code> elements with class="language-mermaid", and change their class name to "mermaid" by:
1
2
3
4
5
6
7
8
<script type="text/javascript">
    const codeElements = document.querySelectorAll('code[class*="language-mermaid"]');
    codeElements.forEach(function (element) {
      if (element.classList.contains('language-mermaid')) {
        element.classList.replace('language-mermaid', 'mermaid');
      }
    });
</script>
After it, the Markdown code can generate Mermaid diagram successfully in Typora and webpages.
In documentations2 and3 there are some Mermaid examples, showing how to use Mermaid syntax to generate different kinds of diagrams. So, in the following text I’ll record some of them.
Mermaid Examples
Sequence Diagrams
1
2
3
4
5
6
7
8
9
10
11
12
13
```mermaid
%% Example of sequence diagram
  sequenceDiagram
    Alice->>Bob: Hello Bob, how are you?
    alt is sick
    Bob->>Alice: Not so good :(
    else is well
    Bob->>Alice: Feeling fresh like a daisy
    end
    opt Extra response
    Bob->>Alice: Thanks for asking
    end
```
%% Example of sequence diagram
  sequenceDiagram
    Alice->>Bob: Hello Bob, how are you?
    alt is sick
    Bob->>Alice: Not so good :(
    else is well
    Bob->>Alice: Feeling fresh like a daisy
    end
    opt Extra response
    Bob->>Alice: Thanks for asking
    end
Flowcharts
1
2
3
4
5
6
7
```mermaid
graph LR
A[Hard edge] -->B(Round edge)
    B --> C{Decision}
    C -->|One| D[Result one]
    C -->|Two| E[Result two]
```
graph LR
A[Hard edge] -->B(Round edge)
    B --> C{Decision}
    C -->|One| D[Result one]
    C -->|Two| E[Result two]
Gantt Charts
1
2
3
4
5
6
7
8
9
10
11
12
13
14
15
16
17
18
19
20
21
22
23
24
25
26
27
28
29
30
```mermaid
%% Example with selection of syntaxes
        gantt
        dateFormat  YYYY-MM-DD
        title Adding GANTT diagram functionality to mermaid

        section A section
        Completed task            :done,    des1, 2014-01-06,2014-01-08
        Active task               :active,  des2, 2014-01-09, 3d
        Future task               :         des3, after des2, 5d
        Future task2               :         des4, after des3, 5d

        section Critical tasks
        Completed task in the critical line :crit, done, 2014-01-06,24h
        Implement parser and jison          :crit, done, after des1, 2d
        Create tests for parser             :crit, active, 3d
        Future task in critical line        :crit, 5d
        Create tests for renderer           :2d
        Add to mermaid                      :1d

        section Documentation
        Describe gantt syntax               :active, a1, after des1, 3d
        Add gantt diagram to demo page      :after a1  , 20h
        Add another diagram to demo page    :doc1, after a1  , 48h

        section Last section
        Describe gantt syntax               :after doc1, 3d
        Add gantt diagram to demo page      : 20h
        Add another diagram to demo page    : 48h
```
%% Example with selection of syntaxes
        gantt
        dateFormat  YYYY-MM-DD
        title Adding GANTT diagram functionality to mermaid

        section A section
        Completed task            :done,    des1, 2014-01-06,2014-01-08
        Active task               :active,  des2, 2014-01-09, 3d
        Future task               :         des3, after des2, 5d
        Future task2               :         des4, after des3, 5d

        section Critical tasks
        Completed task in the critical line :crit, done, 2014-01-06,24h
        Implement parser and jison          :crit, done, after des1, 2d
        Create tests for parser             :crit, active, 3d
        Future task in critical line        :crit, 5d
        Create tests for renderer           :2d
        Add to mermaid                      :1d

        section Documentation
        Describe gantt syntax               :active, a1, after des1, 3d
        Add gantt diagram to demo page      :after a1  , 20h
        Add another diagram to demo page    :doc1, after a1  , 48h

        section Last section
        Describe gantt syntax               :after doc1, 3d
        Add gantt diagram to demo page      : 20h
        Add another diagram to demo page    : 48h
Bar Charts (using gantt chart)
1
2
3
4
5
6
7
8
9
10
11
12
13
14
15
16
17
```mermaid
gantt
    title Git Issues - days since last update
    dateFormat  X
    axisFormat %s

    section Issue19062
    71   : 0, 71
    section Issue19401
    36   : 0, 36
    section Issue193
    34   : 0, 34
    section Issue7441
    9    : 0, 9
    section Issue1300
    5    : 0, 5
```
gantt
    title Git Issues - days since last update
    dateFormat  X
    axisFormat %s

    section Issue19062
    71   : 0, 71
    section Issue19401
    36   : 0, 36
    section Issue193
    34   : 0, 34
    section Issue7441
    9    : 0, 9
    section Issue1300
    5    : 0, 5
Class Diagrams
1
2
3
4
5
6
7
8
9
10
11
12
13
14
15
16
17
18
19
20
21
22
23
```mermaid
classDiagram
      Animal <|-- Duck
      Animal <|-- Fish
      Animal <|-- Zebra
      Animal : +int age
      Animal : +String gender
      Animal: +isMammal()
      Animal: +mate()
      class Duck{
          +String beakColor
          +swim()
          +quack()
      }
      class Fish{
          -int sizeInFeet
          -canEat()
      }
      class Zebra{
          +bool is_wild
          +run()
      }
```
classDiagram
      Animal <|-- Duck
      Animal <|-- Fish
      Animal <|-- Zebra
      Animal : +int age
      Animal : +String gender
      Animal: +isMammal()
      Animal: +mate()
      class Duck{
          +String beakColor
          +swim()
          +quack()
      }
      class Fish{
          -int sizeInFeet
          -canEat()
      }
      class Zebra{
          +bool is_wild
          +run()
      }
State Diagrams
1
2
3
4
5
6
7
8
9
```mermaid
stateDiagram
    [*] --> Still
    Still --> [*]
    Still --> Moving
    Moving --> Still
    Moving --> Crash
    Crash --> [*]
```
stateDiagram
    [*] --> Still
    Still --> [*]
    Still --> Moving
    Moving --> Still
    Moving --> Crash
    Crash --> [*]
Pie Charts
1
2
3
4
5
6
7
```mermaid
pie
    title Pie Chart
    "Dogs" : 386
    "Cats" : 85
    "Rats" : 150
```
pie
    title Pie Chart
    "Dogs" : 386
    "Cats" : 85
    "Rats" : 150
Requirement Diagrams
1
2
3
4
5
6
7
8
9
10
11
12
13
14
15
16
```mermaid
	requirementDiagram

    requirement test_req {
    id: 1
    text: the test text.
    risk: high
    verifymethod: test
    }

    element test_entity {
    type: simulation
    }

    test_entity - satisfies -> test_req
```
	requirementDiagram

    requirement test_req {
    id: 1
    text: the test text.
    risk: high
    verifymethod: test
    }

    element test_entity {
    type: simulation
    }

    test_entity - satisfies -> test_req
Gitgraph Diagrams / Commit Flow Diagrams
1
2
3
4
5
6
7
8
9
10
11
12
13
```mermaid
gitGraph
       commit
       commit
       branch develop
       checkout develop
       commit
       commit
       checkout main
       merge develop
       commit
       commit
```
gitGraph
       commit
       commit
       branch develop
       checkout develop
       commit
       commit
       checkout main
       merge develop
       commit
       commit
Mindamp
1
2
3
4
5
6
7
8
9
10
11
12
13
14
15
16
17
18
19
```mermaid
mindmap
  root((mindmap))
    Origins
      Long history
      ::icon(fa fa-book)
      Popularisation
        British popular psychology author Tony Buzan
    Research
      On effectiveness<br/>and features
      On Automatic creation
        Uses
            Creative techniques
            Strategic planning
            Argument mapping
    Tools
      Pen and paper
      Mermaid
```
mindmap
  root((mindmap))
    Origins
      Long history
      ::icon(fa fa-book)
      Popularisation
        British popular psychology author Tony Buzan
    Research
      On effectiveness<br/>and features
      On Automatic creation
        Uses
            Creative techniques
            Strategic planning
            Argument mapping
    Tools
      Pen and paper
      Mermaid
Timeline
1
2
3
4
5
6
7
8
```mermaid
timeline
    title History of Social Media Platform
    2002 : LinkedIn
    2004 : Facebook : Google
    2005 : Youtube
    2006 : Twitter
```
timeline
    title History of Social Media Platform
    2002 : LinkedIn
    2004 : Facebook : Google
    2005 : Youtube
    2006 : Twitter
Quadrant Charts
1
2
3
4
5
6
7
8
9
10
11
12
13
14
15
16
```mermaid
quadrantChart
    title Reach and engagement of campaigns
    x-axis Low Reach --> High Reach
    y-axis Low Engagement --> High Engagement
    quadrant-1 We should expand
    quadrant-2 Need to promote
    quadrant-3 Re-evaluate
    quadrant-4 May be improved
    Campaign A: [0.3, 0.6]
    Campaign B: [0.45, 0.23]
    Campaign C: [0.57, 0.69]
    Campaign D: [0.78, 0.34]
    Campaign E: [0.40, 0.34]
    Campaign F: [0.35, 0.78]
```
quadrantChart
    title Reach and engagement of campaigns
    x-axis Low Reach --> High Reach
    y-axis Low Engagement --> High Engagement
    quadrant-1 We should expand
    quadrant-2 Need to promote
    quadrant-3 Re-evaluate
    quadrant-4 May be improved
    Campaign A: [0.3, 0.6]
    Campaign B: [0.45, 0.23]
    Campaign C: [0.57, 0.69]
    Campaign D: [0.78, 0.34]
    Campaign E: [0.40, 0.34]
    Campaign F: [0.35, 0.78]
Sankey Diagrams
1
2
3
4
5
6
7
8
9
10
11
12
13
14
15
16
17
18
19
20
21
22
23
24
25
26
27
28
29
30
31
32
33
34
35
36
37
38
39
40
41
42
43
44
45
46
47
48
49
50
51
52
53
54
55
56
57
58
59
60
61
62
63
64
65
66
67
68
69
70
71
72
73
74
75
76
77
```mermaid
---
config:
  sankey:
    showValues: false
---
sankey-beta

Agricultural 'waste',Bio-conversion,124.729
Bio-conversion,Liquid,0.597
Bio-conversion,Losses,26.862
Bio-conversion,Solid,280.322
Bio-conversion,Gas,81.144
Biofuel imports,Liquid,35
Biomass imports,Solid,35
Coal imports,Coal,11.606
Coal reserves,Coal,63.965
Coal,Solid,75.571
District heating,Industry,10.639
District heating,Heating and cooling - commercial,22.505
District heating,Heating and cooling - homes,46.184
Electricity grid,Over generation / exports,104.453
Electricity grid,Heating and cooling - homes,113.726
Electricity grid,H2 conversion,27.14
Electricity grid,Industry,342.165
Electricity grid,Road transport,37.797
Electricity grid,Agriculture,4.412
Electricity grid,Heating and cooling - commercial,40.858
Electricity grid,Losses,56.691
Electricity grid,Rail transport,7.863
Electricity grid,Lighting & appliances - commercial,90.008
Electricity grid,Lighting & appliances - homes,93.494
Gas imports,Ngas,40.719
Gas reserves,Ngas,82.233
Gas,Heating and cooling - commercial,0.129
Gas,Losses,1.401
Gas,Thermal generation,151.891
Gas,Agriculture,2.096
Gas,Industry,48.58
Geothermal,Electricity grid,7.013
H2 conversion,H2,20.897
H2 conversion,Losses,6.242
H2,Road transport,20.897
Hydro,Electricity grid,6.995
Liquid,Industry,121.066
Liquid,International shipping,128.69
Liquid,Road transport,135.835
Liquid,Domestic aviation,14.458
Liquid,International aviation,206.267
Liquid,Agriculture,3.64
Liquid,National navigation,33.218
Liquid,Rail transport,4.413
Marine algae,Bio-conversion,4.375
Ngas,Gas,122.952
Nuclear,Thermal generation,839.978
Oil imports,Oil,504.287
Oil reserves,Oil,107.703
Oil,Liquid,611.99
Other waste,Solid,56.587
Other waste,Bio-conversion,77.81
Pumped heat,Heating and cooling - homes,193.026
Pumped heat,Heating and cooling - commercial,70.672
Solar PV,Electricity grid,59.901
Solar Thermal,Heating and cooling - homes,19.263
Solar,Solar Thermal,19.263
Solar,Solar PV,59.901
Solid,Agriculture,0.882
Solid,Thermal generation,400.12
Solid,Industry,46.477
Thermal generation,Electricity grid,525.531
Thermal generation,Losses,787.129
Thermal generation,District heating,79.329
Tidal,Electricity grid,9.452
UK land based bioenergy,Bio-conversion,182.01
Wave,Electricity grid,19.013
Wind,Electricity grid,289.366
```
---
config:
  sankey:
    showValues: false
---
sankey-beta

Agricultural 'waste',Bio-conversion,124.729
Bio-conversion,Liquid,0.597
Bio-conversion,Losses,26.862
Bio-conversion,Solid,280.322
Bio-conversion,Gas,81.144
Biofuel imports,Liquid,35
Biomass imports,Solid,35
Coal imports,Coal,11.606
Coal reserves,Coal,63.965
Coal,Solid,75.571
District heating,Industry,10.639
District heating,Heating and cooling - commercial,22.505
District heating,Heating and cooling - homes,46.184
Electricity grid,Over generation / exports,104.453
Electricity grid,Heating and cooling - homes,113.726
Electricity grid,H2 conversion,27.14
Electricity grid,Industry,342.165
Electricity grid,Road transport,37.797
Electricity grid,Agriculture,4.412
Electricity grid,Heating and cooling - commercial,40.858
Electricity grid,Losses,56.691
Electricity grid,Rail transport,7.863
Electricity grid,Lighting & appliances - commercial,90.008
Electricity grid,Lighting & appliances - homes,93.494
Gas imports,Ngas,40.719
Gas reserves,Ngas,82.233
Gas,Heating and cooling - commercial,0.129
Gas,Losses,1.401
Gas,Thermal generation,151.891
Gas,Agriculture,2.096
Gas,Industry,48.58
Geothermal,Electricity grid,7.013
H2 conversion,H2,20.897
H2 conversion,Losses,6.242
H2,Road transport,20.897
Hydro,Electricity grid,6.995
Liquid,Industry,121.066
Liquid,International shipping,128.69
Liquid,Road transport,135.835
Liquid,Domestic aviation,14.458
Liquid,International aviation,206.267
Liquid,Agriculture,3.64
Liquid,National navigation,33.218
Liquid,Rail transport,4.413
Marine algae,Bio-conversion,4.375
Ngas,Gas,122.952
Nuclear,Thermal generation,839.978
Oil imports,Oil,504.287
Oil reserves,Oil,107.703
Oil,Liquid,611.99
Other waste,Solid,56.587
Other waste,Bio-conversion,77.81
Pumped heat,Heating and cooling - homes,193.026
Pumped heat,Heating and cooling - commercial,70.672
Solar PV,Electricity grid,59.901
Solar Thermal,Heating and cooling - homes,19.263
Solar,Solar Thermal,19.263
Solar,Solar PV,59.901
Solid,Agriculture,0.882
Solid,Thermal generation,400.12
Solid,Industry,46.477
Thermal generation,Electricity grid,525.531
Thermal generation,Losses,787.129
Thermal generation,District heating,79.329
Tidal,Electricity grid,9.452
UK land based bioenergy,Bio-conversion,182.01
Wave,Electricity grid,19.013
Wind,Electricity grid,289.366
ZenUML
1
2
3
4
5
6
7
```mermaid
zenuml
    title Demo
    Alice->John: Hello John, how are you?
    John->Alice: Great!
    Alice->John: See you later!
```
zenuml
    title Demo
    Alice->John: Hello John, how are you?
    John->Alice: Great!
    Alice->John: See you later!
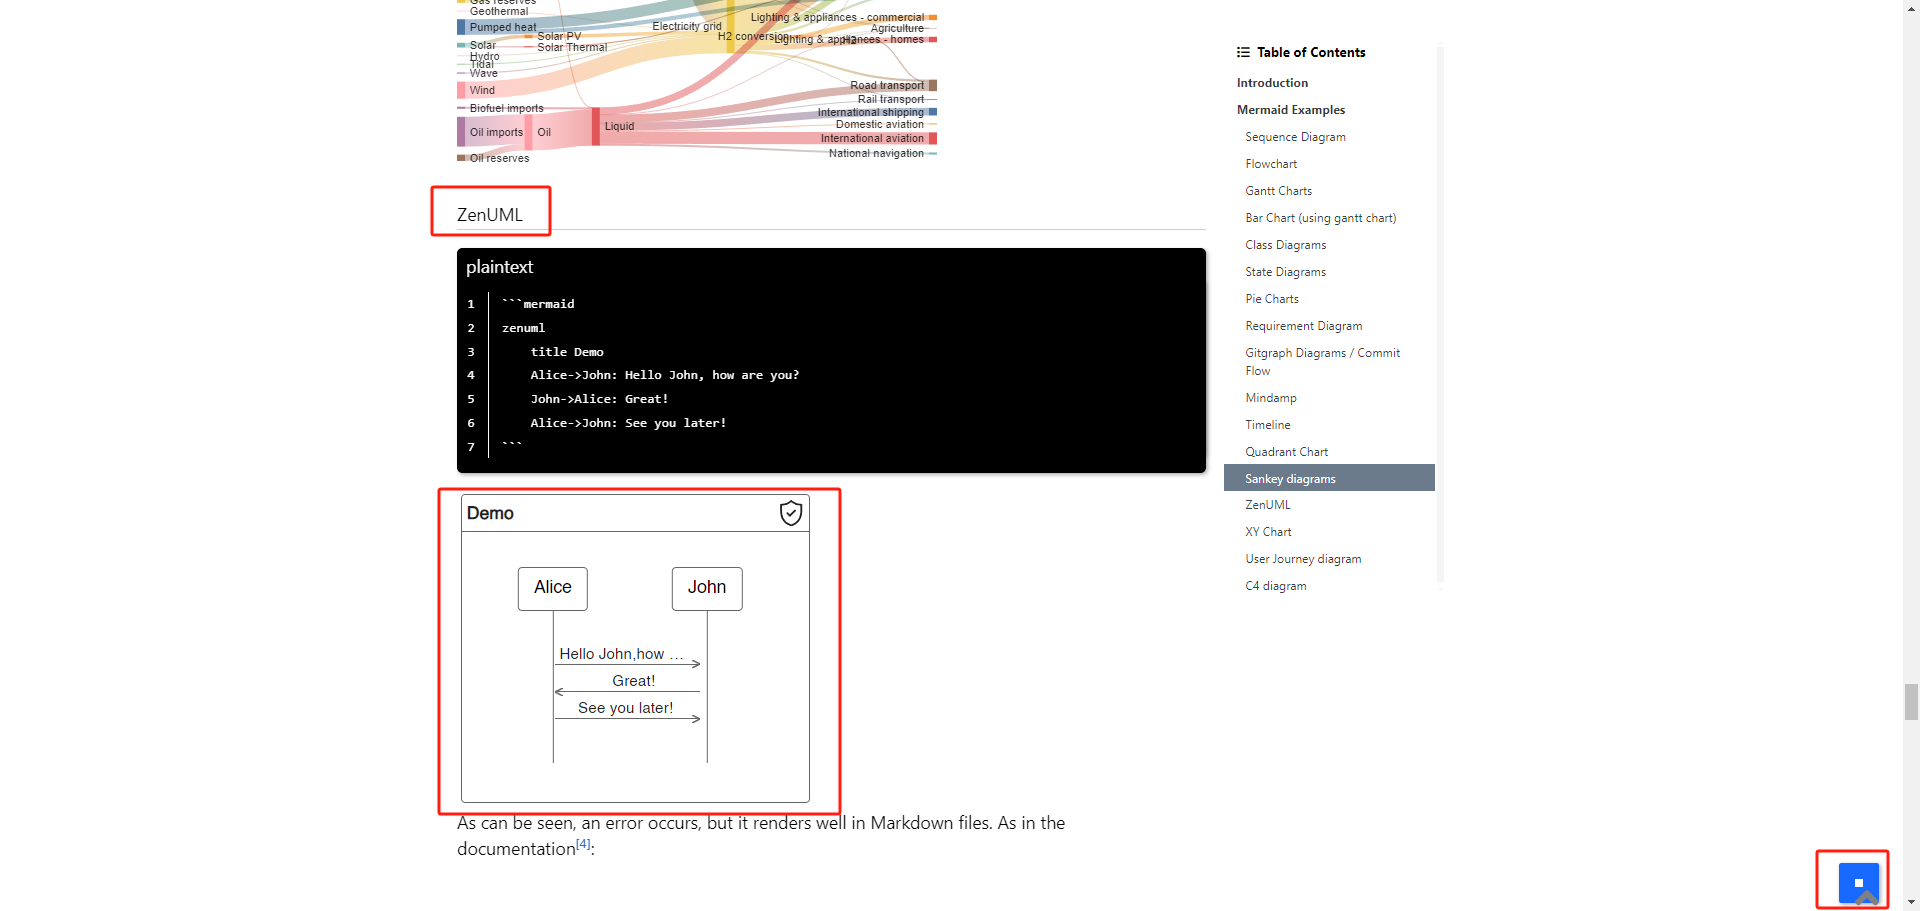
As can be seen, an error occurs, but it renders well in Typora. As in the documentation4:
Mermaid can render sequence diagrams with ZenUML. Note that ZenUML uses a different syntax than the original Sequence Diagram in mermaid.
……
Integrating with your library/website.
Zenuml uses the experimental lazy loading & async rendering features which could change in the future.
You can use this method to add mermaid including the zenuml diagram to a web page:
1
2
3
4
5
<script type="module">
  import mermaid from 'https://cdn.jsdelivr.net/npm/mermaid@10/dist/mermaid.esm.min.mjs';
  import zenuml from 'https://cdn.jsdelivr.net/npm/@mermaid-js/mermaid-zenuml@0.1.0/dist/mermaid-zenuml.esm.min.mjs';
  await mermaid.registerExternalDiagrams([zenuml]);
</script>
ZenUML seems relatively standalone and needs to import other modules from CDN. If I replace Script 1 with Script 2, this ZenUML diagram appears normally in webpage, but meanwhile, many elements, such as Caption and Back-To-Top button (along with some others), happen to change:
I haven’t found any other way to correct it, so finally I choose Script 1, rather than Script 2, to import Mermaid from CDN, leaving aside this error.
XY Charts
1
2
3
4
5
6
7
8
```mermaid
xychart-beta
    title "Sales Revenue"
    x-axis [jan, feb, mar, apr, may, jun, jul, aug, sep, oct, nov, dec]
    y-axis "Revenue (in $)" 4000 --> 11000
    bar [5000, 6000, 7500, 8200, 9500, 10500, 11000, 10200, 9200, 8500, 7000, 6000]
    line [5000, 6000, 7500, 8200, 9500, 10500, 11000, 10200, 9200, 8500, 7000, 6000]
```
xychart-beta
    title "Sales Revenue"
    x-axis [jan, feb, mar, apr, may, jun, jul, aug, sep, oct, nov, dec]
    y-axis "Revenue (in $)" 4000 --> 11000
    bar [5000, 6000, 7500, 8200, 9500, 10500, 11000, 10200, 9200, 8500, 7000, 6000]
    line [5000, 6000, 7500, 8200, 9500, 10500, 11000, 10200, 9200, 8500, 7000, 6000]
User Journey Diagrams
1
2
3
4
5
6
7
8
9
10
11
```mermaid
  journey
    title My working day
    section Go to work
      Make tea: 5: Me
      Go upstairs: 3: Me
      Do work: 1: Me, Cat
    section Go home
      Go downstairs: 5: Me
      Sit down: 3: Me
```
  journey
    title My working day
    section Go to work
      Make tea: 5: Me
      Go upstairs: 3: Me
      Do work: 1: Me, Cat
    section Go home
      Go downstairs: 5: Me
      Sit down: 3: Me
C4 Diagrams
1
2
3
4
5
6
7
8
9
10
11
12
13
14
15
16
17
18
19
20
21
22
23
24
25
26
27
28
29
30
31
32
33
34
```mermaid
C4Context
title System Context diagram for Internet Banking System

Person(customerA, "Banking Customer A", "A customer of the bank, with personal bank accounts.")
Person(customerB, "Banking Customer B")
Person_Ext(customerC, "Banking Customer C")
System(SystemAA, "Internet Banking System", "Allows customers to view information about their bank accounts, and make payments.")

Person(customerD, "Banking Customer D", "A customer of the bank, <br/> with personal bank accounts.")

Enterprise_Boundary(b1, "BankBoundary") {

  SystemDb_Ext(SystemE, "Mainframe Banking System", "Stores all of the core banking information about customers, accounts, transactions, etc.")

  System_Boundary(b2, "BankBoundary2") {
    System(SystemA, "Banking System A")
    System(SystemB, "Banking System B", "A system of the bank, with personal bank accounts.")
  }

  System_Ext(SystemC, "E-mail system", "The internal Microsoft Exchange e-mail system.")
  SystemDb(SystemD, "Banking System D Database", "A system of the bank, with personal bank accounts.")

  Boundary(b3, "BankBoundary3", "boundary") {
    SystemQueue(SystemF, "Banking System F Queue", "A system of the bank, with personal bank accounts.")
    SystemQueue_Ext(SystemG, "Banking System G Queue", "A system of the bank, with personal bank accounts.")
  }
}

BiRel(customerA, SystemAA, "Uses")
BiRel(SystemAA, SystemE, "Uses")
Rel(SystemAA, SystemC, "Sends e-mails", "SMTP")
Rel(SystemC, customerA, "Sends e-mails to")
```
C4Context
title System Context diagram for Internet Banking System

Person(customerA, "Banking Customer A", "A customer of the bank, with personal bank accounts.")
Person(customerB, "Banking Customer B")
Person_Ext(customerC, "Banking Customer C")
System(SystemAA, "Internet Banking System", "Allows customers to view information about their bank accounts, and make payments.")

Person(customerD, "Banking Customer D", "A customer of the bank, <br/> with personal bank accounts.")

Enterprise_Boundary(b1, "BankBoundary") {

  SystemDb_Ext(SystemE, "Mainframe Banking System", "Stores all of the core banking information about customers, accounts, transactions, etc.")

  System_Boundary(b2, "BankBoundary2") {
    System(SystemA, "Banking System A")
    System(SystemB, "Banking System B", "A system of the bank, with personal bank accounts.")
  }

  System_Ext(SystemC, "E-mail system", "The internal Microsoft Exchange e-mail system.")
  SystemDb(SystemD, "Banking System D Database", "A system of the bank, with personal bank accounts.")

  Boundary(b3, "BankBoundary3", "boundary") {
    SystemQueue(SystemF, "Banking System F Queue", "A system of the bank, with personal bank accounts.")
    SystemQueue_Ext(SystemG, "Banking System G Queue", "A system of the bank, with personal bank accounts.")
  }
}

BiRel(customerA, SystemAA, "Uses")
BiRel(SystemAA, SystemE, "Uses")
Rel(SystemAA, SystemC, "Sends e-mails", "SMTP")
Rel(SystemC, customerA, "Sends e-mails to")
References