Update Python Package using Pip
These days I’m re-learning Python. I think it’s good to start from scientific drawing, so I find a simple example, Bar color demo1, in Python Matplotlib documentation, showing as follows:
1
2
3
4
5
6
7
8
9
10
11
12
13
14
15
16
import matplotlib.pyplot as plt

fig, ax = plt.subplots()

fruits = ['apple', 'blueberry', 'cherry', 'orange']
counts = [40, 100, 30, 55]
bar_labels = ['red', 'blue', '_red', 'orange']
bar_colors = ['tab:red', 'tab:blue', 'tab:red', 'tab:orange']

ax.bar(fruits, counts, label=bar_labels, color=bar_colors)

ax.set_ylabel('fruit supply')
ax.set_title('Fruit supply by kind and color')
ax.legend(title='Fruit color')

plt.show()
After running this script, I got a figure:
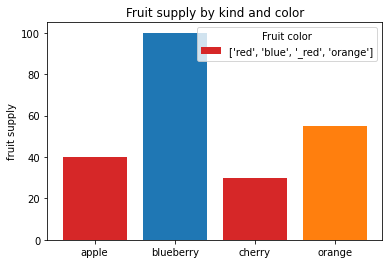
but it is different from that showed in the official documentation: the legend doesn’t display correctly.
I tried another example, Grouped bar chart with labels2, and the problem exists the same. So I guess it is caused by mismatched version. The Python and relevant packages in my computer were installed over a year ago, and the version of Matplotlib package is 3.5.2:
1
2
3
4
In: import matplotlib
In: matplotlib.__version__

Out: '3.5.2'
but the documentation which I refer to now is the latest stable version 3.9, so the script cannot be executed expectedly. Therefore, I decide to update Matplotlib package, and the used command is3:
1
pip install --upgrade matplotlib --user
NOTE:
--useroption cannot be neglected, otherwise an error will occur:
After successfully updating and restarting the kernel, Matplotlib package becomes version 3.9.0:
1
2
3
4
In: import matplotlib
In: matplotlib.__version__

Out: '3.9.0'
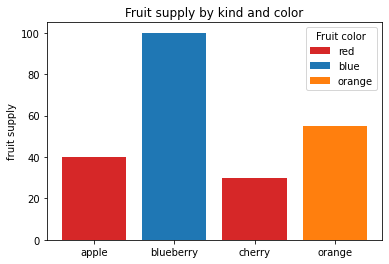
At this time, the generated image is correct if running the script again:
References