An Example of Annotating Equation in LaTeX Using Colored Box and TikZ Package
May. 04, 2024 • Updated Jan. 25, 2025
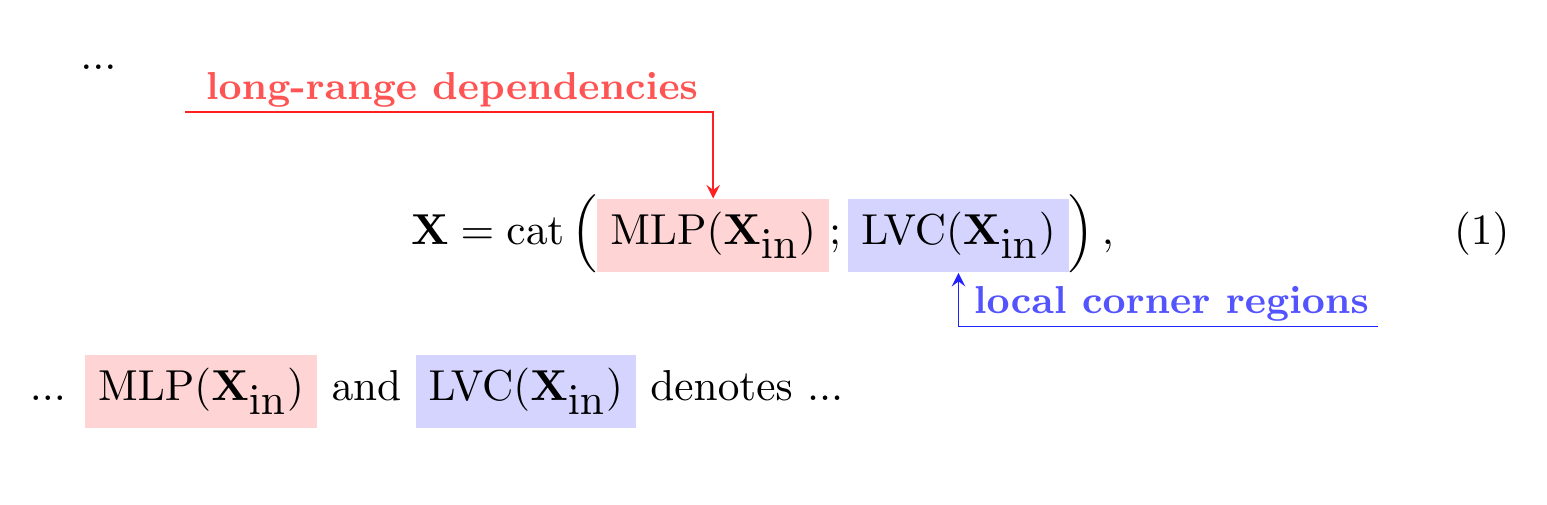
Few days ago, I read Quan et al.’s paper, Centralized Feature Pyramid for Object Detection1, and found an elegant example of annotating equation by using LaTeX colored box and TikZ package.
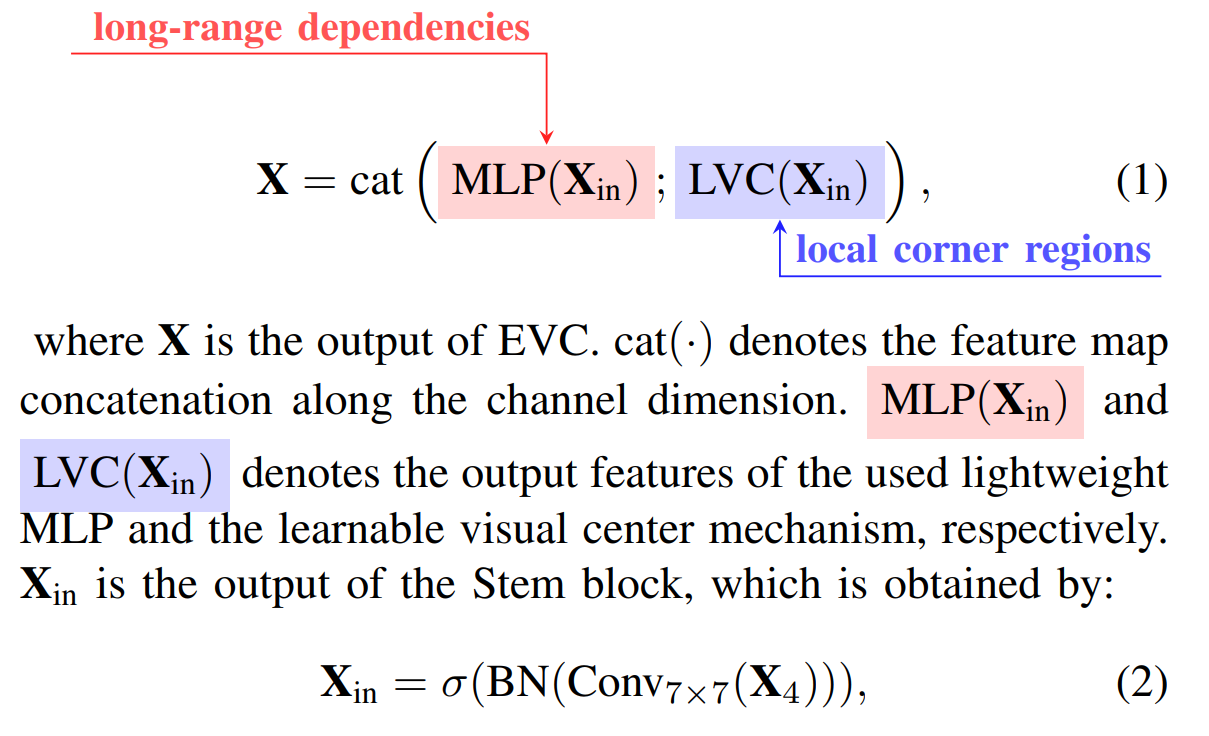
For learning, I pick out the minimal code to generate it from the source file they provided1.
1
2
3
4
5
6
7
8
9
10
11
12
13
14
15
16
17
18
19
20
21
22
23
24
25
26
27
28
29
30
31
32
33
\documentclass{article}
\usepackage[dvipsnames]{xcolor}
\usepackage{tikz}
\usetikzlibrary{tikzmark}

\newcommand{\highlight}[2]{\colorbox{#1!17}{$\displaystyle #2$}}
\renewcommand{\highlight}[2]{\colorbox{#1!17}{#2}}

\begin{document}
\vspace*{\fill}
...
\vspace{10mm}
\begin{equation}
	\vspace{\baselineskip}
	\label{eq2}
	\textbf{X} = \textrm{cat}\left(
	\tikzmarknode{x}{\highlight{red}{$\textrm{MLP}(\textbf{X}_{\textrm{in}})$}};
	\tikzmarknode{s}{\highlight{blue}{$\textrm{LVC}(\textbf{X}_{\textrm{in}})$}}\right),
\end{equation}
\begin{tikzpicture}[overlay,remember picture,>=stealth,nodes={align=left,inner ysep=1pt},<-]
	% For node "x"
	\path (x.north)++(0,2em) node[anchor=south east,color=red!67] (scalep)
		{\textbf{\small long-range dependencies}};
	\draw [color=red!87] (x.north) |- ([xshift=-0.3ex,color=red] scalep.south west);

	% For node "s"
	\path (s.south)++(0,-.2em) node[anchor=north west,color=blue!67] (mean)
		{\textbf{\small local corner regions}};
	\draw [color=blue!87] (s.south) |- ([xshift=-0.3ex,color=blue] mean.south east);
\end{tikzpicture}
... ${\highlight{red}{$\textrm{MLP}(\textbf{X}_{\textrm{in}})$}}$ and ${\highlight{blue}{$\textrm{LVC}(\textbf{X}_{\textrm{in}})$}}$ denotes ...
\vspace*{\fill}
\end{document}
References
-
Y. Quan, D. Zhang, L. Zhang and J. Tang, “Centralized Feature Pyramid for Object Detection,” in IEEE Transactions on Image Processing, vol. 32, pp. 4341-4354, 2023, doi: 10.1109/TIP.2023.3297408, available at: Centralized Feature Pyramid for Object Detection, or [2210.02093] Centralized Feature Pyramid for Object Detection. ˄ ˄2