Fetch Series Data from Federal Reserve Economic Data (FRED) Sever in MATLAB: take S&P 500 price index
Fetch S&P 500 price index from FRED server
MATLAB computational finance products (specifically MATLAB Datafeed Toolbox1) provide a fred function2 to “Connect to FRED data servers” (FRED, Federal Reserve Economic Data3), and an example, “Retrieve Current Financial Data Using Datafeed Toolbox”4, showing how to use it to fetch S&P 500 price index (which does not contain dividends, and is different from the total return index):
1
2
3
4
5
6
7
8
9
10
clc,clear,close all

% Connect to the FRED data server at https://research.stlouisfed.org/fred2/
connection = fred("https://research.stlouisfed.org/fred2/");

% Retrieve S&P 500 series financial data
SP500 = fetch(connection,"SP500");

% Close FRED connection
close(connection)
and all information is stored in SP500 variable:
1
2
3
4
5
6
7
8
9
10
11
12
13
14
15
16
17
>> SP500

SP500 =

  struct with fields:

                 Title: ' S&P 500'
              SeriesID: ' SP500'
                Source: ' S&P Dow Jones Indices LLC'
               Release: ' Standard & Poors (Not a Press Release)'
    SeasonalAdjustment: ' Not Seasonally Adjusted'
             Frequency: ' Daily, Close'
                 Units: ' Index'
             DateRange: ' 2014-04-17 to 2024-04-16'
           LastUpdated: ' 2024-04-16 7:11 PM CDT'
                 Notes: ' The observations for the S&P 500 represent the daily index value at market close. The market typically closes at 4 PM ET, except for holidays when it sometimes closes early.  The Federal Reserve Bank of St. Louis and S&P Dow Jones Indices LLC have reached a new agreement on the use of Standard & Poors and Dow Jones Averages series in FRED. FRED and its associated services will include 10 years of daily history for Standard & Poors and Dow Jones Averages series.  The S&P 500 is regarded as a gauge of the large cap U.S. equities market. The index includes 500 leading companies in leading industries of the U.S. economy, which are publicly held on either the NYSE or NASDAQ, and covers 75% of U.S. equities. Since this is a price index and not a total return index, the S&P 500 index here does not contain dividends.  Copyright © 2016, S&P Dow Jones Indices LLC. All rights reserved. Reproduction of S&P 500 in any form is prohibited except with the prior written permission of S&P Dow Jones Indices LLC ("S&P"). S&P does not guarantee the accuracy, adequacy, completeness or availability of any information and is not responsible for any errors or omissions, regardless of the cause or for the results obtained from the use of such information. S&P DISCLAIMS ANY AND ALL EXPRESS OR IMPLIED WARRANTIES, INCLUDING, BUT NOT LIMITED TO, ANY WARRANTIES OF MERCHANTABILITY OR FITNESS FOR A PARTICULAR PURPOSE OR USE. In no event shall S&P be liable for any direct, indirect, special or consequential damages, costs, expenses, legal fees, or losses (including lost income or lost profit and opportunity costs) in connection with subscriber's or others' use of S&P 500.  Permission to reproduce S&P 500 can be requested from index_services@spdji.com. More contact details are available here (http://us.spindices.com/contact-us), including phone numbers for all regional offices.'
                  Data: [2609×2 double]
where the array in Data field include date (the first column) and corresponding index data (the second column):
1
2
3
4
5
6
7
>> SP500.Data(1:5,:)
ans =
     735706.00       1864.85
     735707.00           NaN
     735710.00       1871.89
     735711.00       1879.55
     735712.00       1875.39
However, as can be seen, the date type is double class and not that obvious. We can “convert the serial date number to a character vector” by datestr function5 referring to another example “Retrieve Historical Data Using FRED”6:
1
2
time = SP500.Data(:,1);
T = datestr(time);
1
2
3
4
5
>> T(1,:),T(end,:)
ans =
    '17-Apr-2014'
ans =
    '16-Apr-2024'
But datestr function was introduced before MATLAB R2006a, and is not recommended any more. It is better to realize conversion by datetime function7:
1
T2 = datetime(time,"ConvertFrom","datenum");
1
2
3
4
5
6
7
>> T2(1),T2(end)
ans =
  datetime
   2014-04-17
ans =
  datetime
   2024-04-16
The results of both methods have the meaning, but T is a char class array while T2 is datetime:
1
2
3
4
>> whos T T2
  Name         Size            Bytes  Class       Attributes
  T         2609x11            57398  char
  T2        2609x1             20872  datetime
Having said that, both them are consistent with SP500.DateRange. It should be noted that we must explicitly specify the "ConvertFrom" property as "datenum", meaning the input array time represents the “Number of days since 0-Jan-0000 (proleptic ISO calendar)”8. And there are more date types can be found in document8.
Next, we can visualize how S&P 500 changes as date:
1
2
3
4
5
6
figure("Color","w","Position",[359,348,654,522])
hold(gca,"on"),box(gca,"on"),grid(gca,"on")
plot(T2,SP500.Data(:,2),"Color","b")
xtickformat("yyyy")
xlabel("Date")
ylabel("S&P 500 Index")
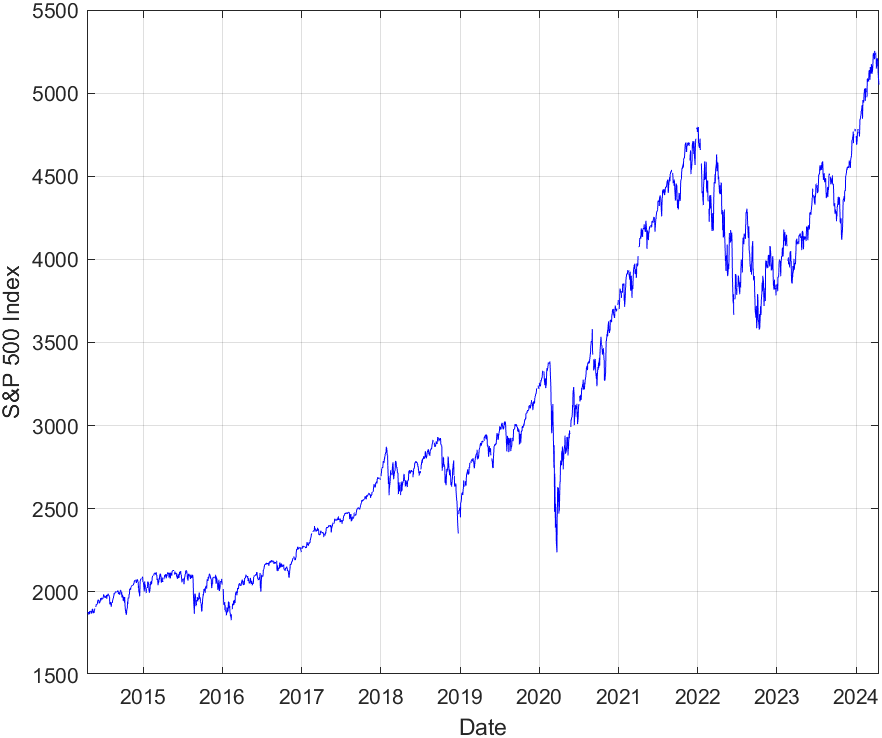
Here, xtickformat function is to specify the x-tick format when plotting data as date or times910.
Retrieve historical data in the specified date range
As described in SP500.Notes field, “… FRED and its associated services will include 10 years of daily history for Standard & Poors and Dow Jones Averages series.” So, the date range of fetched S&P 500 price index is only ten years, which is explicitly displayed by SP500.DateRange field, '2014-04-17 to 2024-04-16'.
On another hand, we could specify the start and ending date of date range for historical data for fetch function6. For example:
1
2
3
4
5
6
7
8
9
10
11
12
13
14
15
16
clc,clear,close all

% Connect to the FRED data server at https://research.stlouisfed.org/fred2/
connection = fred("https://research.stlouisfed.org/fred2/");

% Retrieve S&P 500 series financial data
startdate = "04/12/2023";
enddate = "04/12/2024";
SP500 = fetch(connection,"SP500",startdate,enddate);

% Close FRED connection
close(connection)

% For verifying the date range
time = SP500.Data(:,1);
T = datetime(time,"ConvertFrom","datenum");
1
2
3
4
5
6
7
8
9
10
11
12
13
14
>> SP500
SP500 =
  struct with fields:
                 Title: ' S&P 500'
              SeriesID: ' SP500'
                Source: ' S&P Dow Jones Indices LLC'
               Release: ' Standard & Poors (Not a Press Release)'
    SeasonalAdjustment: ' Not Seasonally Adjusted'
             Frequency: ' Daily, Close'
                 Units: ' Index'
             DateRange: ' 2014-04-17 to 2024-04-16'
           LastUpdated: ' 2024-04-16 7:11 PM CDT'
                 Notes: ' ...'
                  Data: [263×2 double]
1
2
3
4
5
6
7
>> T(1),T(end)
ans =
  datetime
   2023-04-12
ans =
  datetime
   2024-04-12
It works. But it should be noted that, at this time, SP500.DateRange is STILL '2014-04-17 to 2024-04-16', the same as the previous one. The only difference is the number of SP500.Data elements.
Besides, if the specified date range exceeds the range of SP500.DateRange, like:
1
2
3
4
5
...
startdate = "04/12/1998";
enddate = "04/12/2025";
SP500 = fetch(connection,"SP500",startdate,enddate);
...
1
2
3
4
5
6
7
8
9
10
11
12
13
14
>> SP500
SP500 =
  struct with fields:
                 Title: ' S&P 500'
              SeriesID: ' SP500'
                Source: ' S&P Dow Jones Indices LLC'
               Release: ' Standard & Poors (Not a Press Release)'
    SeasonalAdjustment: ' Not Seasonally Adjusted'
             Frequency: ' Daily, Close'
                 Units: ' Index'
             DateRange: ' 2014-04-17 to 2024-04-16'
           LastUpdated: ' 2024-04-16 7:11 PM CDT'
                 Notes: ' ...'
                  Data: [2609×2 double]
There is NO warning or error, and the fetched data are the same as without specifying date range.
Fetch other data by series ID
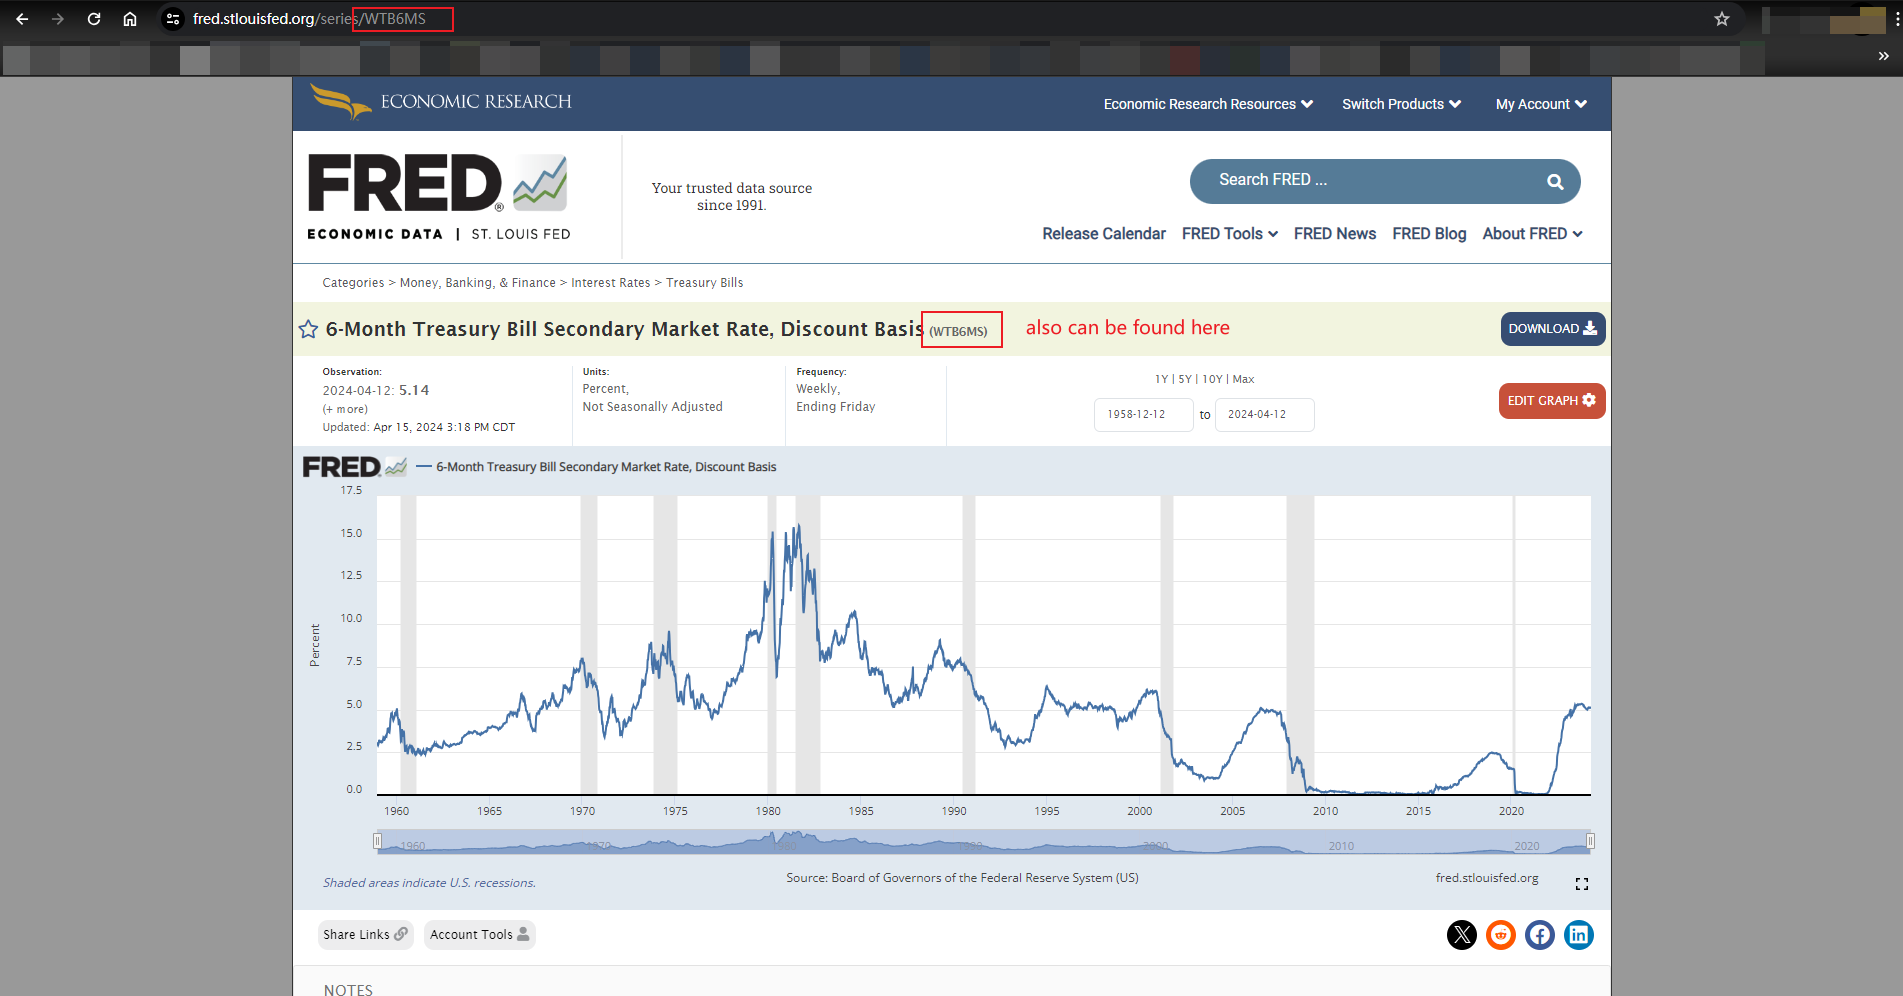
In addition to S&P 500 price index, we can also obtain other series from FRED server, and all available data show in the list 11. But note that how to specify the series property of fetch function: we should find the webpage, whose URL is like https://fred.stlouisfed.org/series/<XXXXX>, and the series ID followed by the last slash, <XXXXX>, is the value should be specified for series property of fetch function. Like for “6-Month Treasury Bill Secondary Market Rate, Discount Basis”, whose series ID is WTB6MS:
then we can fetch it by:
1
2
3
connection = fred("https://research.stlouisfed.org/fred2/");
s = fetch(connection,"WTB6MS");
close(connection)
1
2
3
4
5
6
7
8
9
10
11
12
13
14
>> s
s =
  struct with fields:
                 Title: ' 6-Month Treasury Bill Secondary Market Rate, Discount Basis'
              SeriesID: ' WTB6MS'
                Source: ' Board of Governors of the Federal Reserve System (US)'
               Release: ' H.15 Selected Interest Rates'
    SeasonalAdjustment: ' Not Seasonally Adjusted'
             Frequency: ' Weekly, Ending Friday'
                 Units: ' Percent'
             DateRange: ' 1958-12-12 to 2024-04-12'
           LastUpdated: ' 2024-04-15 3:18 PM CDT'
                 Notes: ' Averages of Business Days, Discount Basis'
                  Data: [3410×2 double]
References
-
Retrieve Current Financial Data Using Datafeed Toolbox - MathWorks. ˄
-
MATLAB
datestr(Not recommended; use string or char): Convert date and time to string format - MathWorks. ˄ -
MATLAB
datetime: Arrays that represent points in time - MathWorks. ˄ -
MATLAB
xtickformat: Specify x-axis tick label format - MathWorks. ˄