LaTeX Multi-figure Layout
\subfloat (subfig package) + \includegraphics
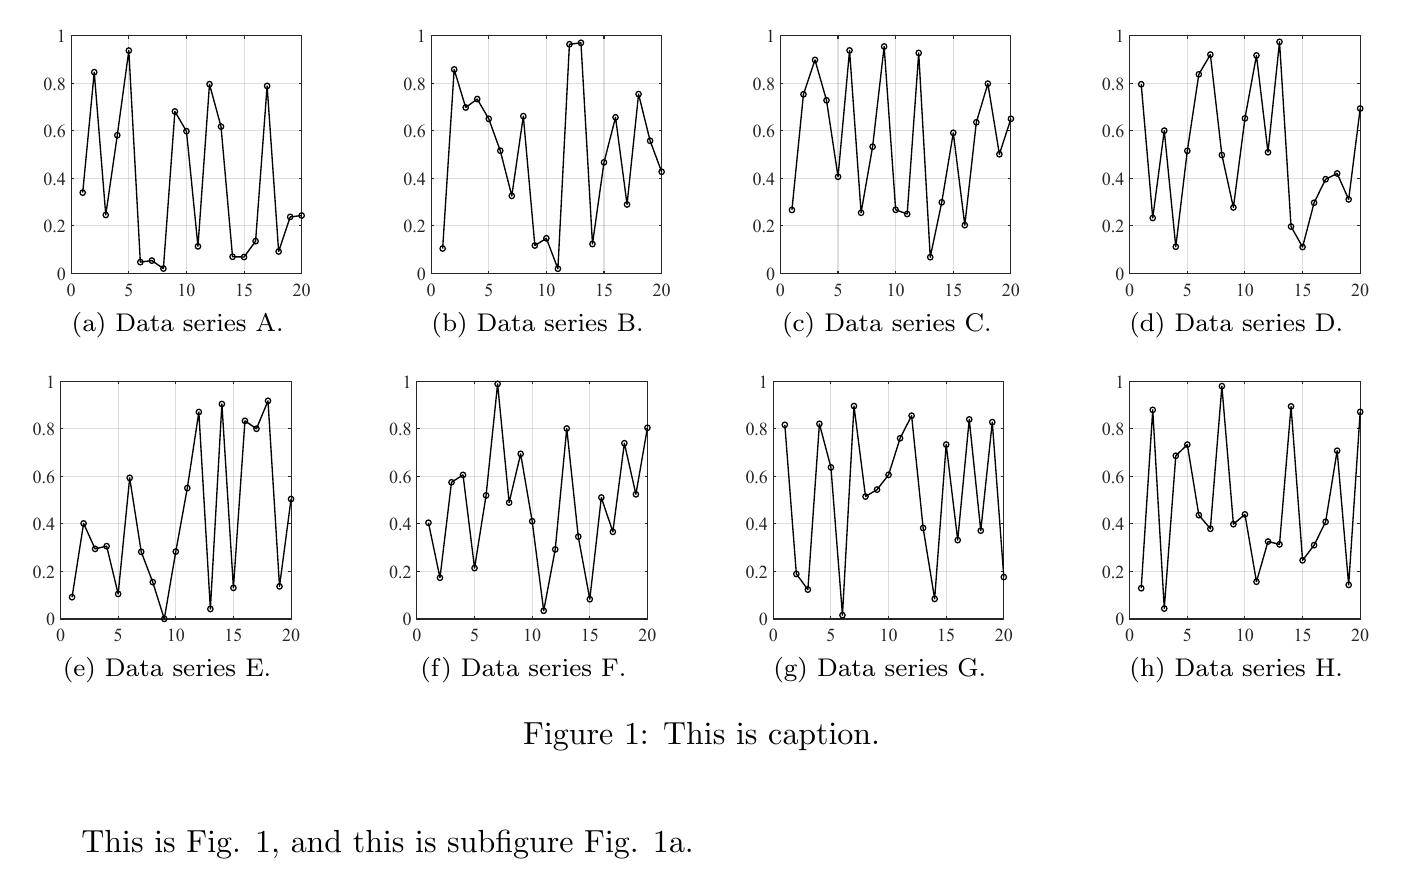
In LaTeX, multiple figures can be organized by combining using \subfloat and \includegraphics commands. The \includegraphics is from graphicx package, and \subfloat is from subfig package. Here is an example.
1
2
3
4
5
6
7
8
9
10
11
12
13
14
15
16
17
18
19
20
21
22
23
24
25
\documentclass{article}
\usepackage{graphicx,subfig}
\usepackage{geometry}
\geometry{a4paper}
\begin{document}
\begin{figure}
\def\CE{0.20}
\centering
\subfloat[Data series A.]{\includegraphics[height=\CE\textwidth, width=\CE\textwidth]{pic-1.pdf}\label{fig-a}}\hfill
\subfloat[Data series B.]{\includegraphics[height=\CE\textwidth, width=\CE\textwidth]{pic-2.pdf}}\hfill
\subfloat[Data series C.]{\includegraphics[height=\CE\textwidth, width=\CE\textwidth]{pic-3.pdf}}\hfill
\subfloat[Data series D.]{\includegraphics[height=\CE\textwidth, width=\CE\textwidth]{pic-4.pdf}}\hfill
\subfloat[Data series E.]{\includegraphics[height=\CE\textwidth, width=\CE\textwidth]{pic-5.pdf}}\hfill
\subfloat[Data series F.]{\includegraphics[height=\CE\textwidth, width=\CE\textwidth]{pic-6.pdf}}\hfill
\subfloat[Data series G.]{\includegraphics[height=\CE\textwidth, width=\CE\textwidth]{pic-7.pdf}}\hfill
\subfloat[Data series H.]{\includegraphics[height=\CE\textwidth, width=\CE\textwidth]{pic-8.pdf}}
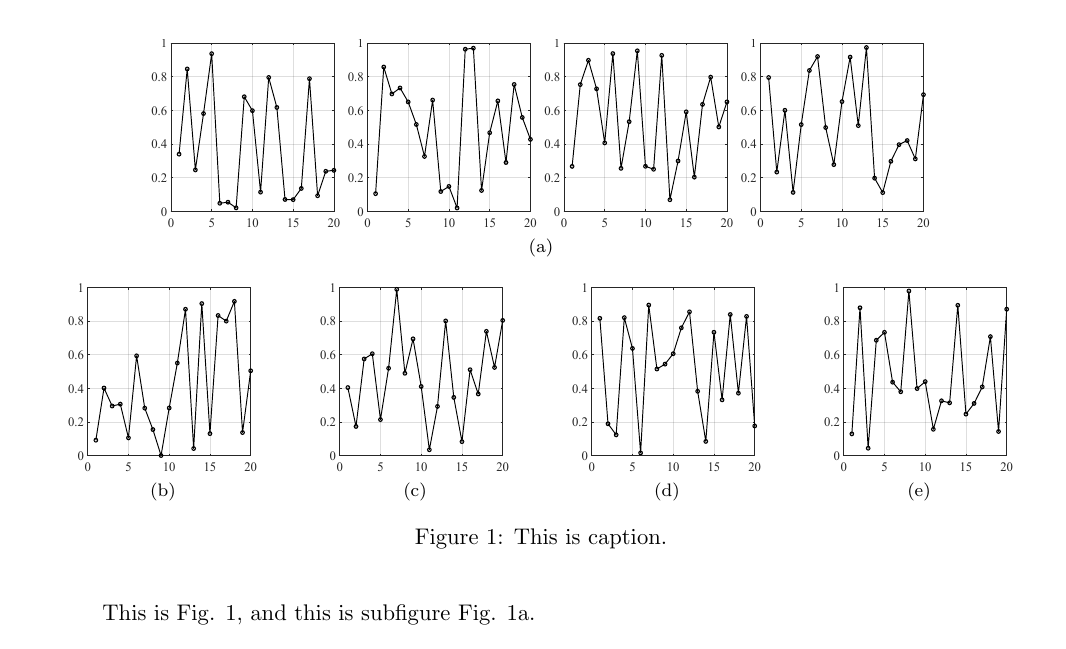
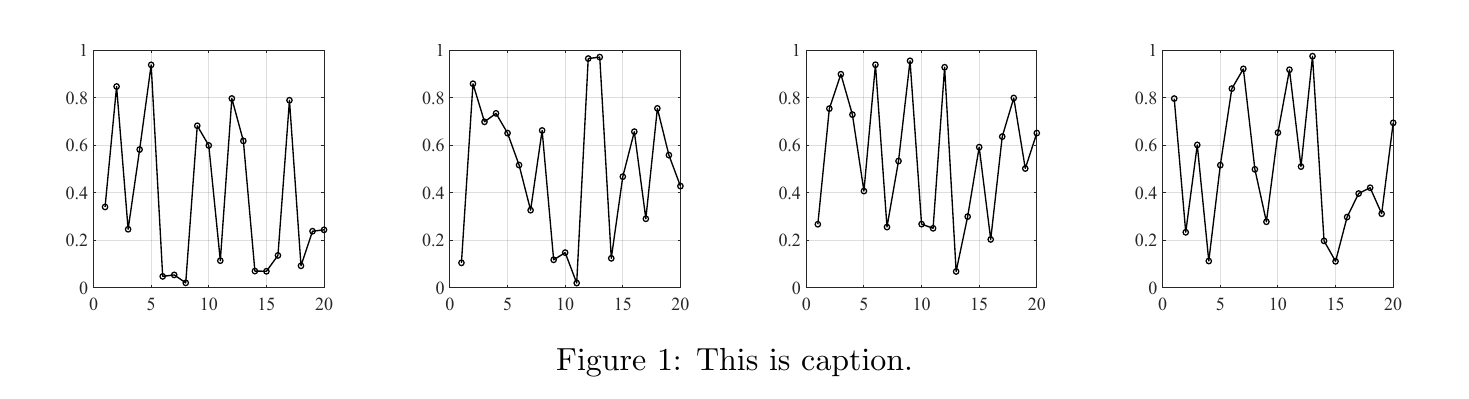
\caption{This is caption.}
\label{fig}
\end{figure}
This is Fig. \ref{fig}, and this is subfigure Fig. \ref{fig-a}.
\end{document}
(1) The title of sub-figure is specified in the \subfloat option, if don’t want to make a title for it, just leave a space in \subfloat[], like:
1
\subfloat[]{\includegraphics[height=\CE\textwidth, width=\CE\textwidth]{pic-8.pdf}}
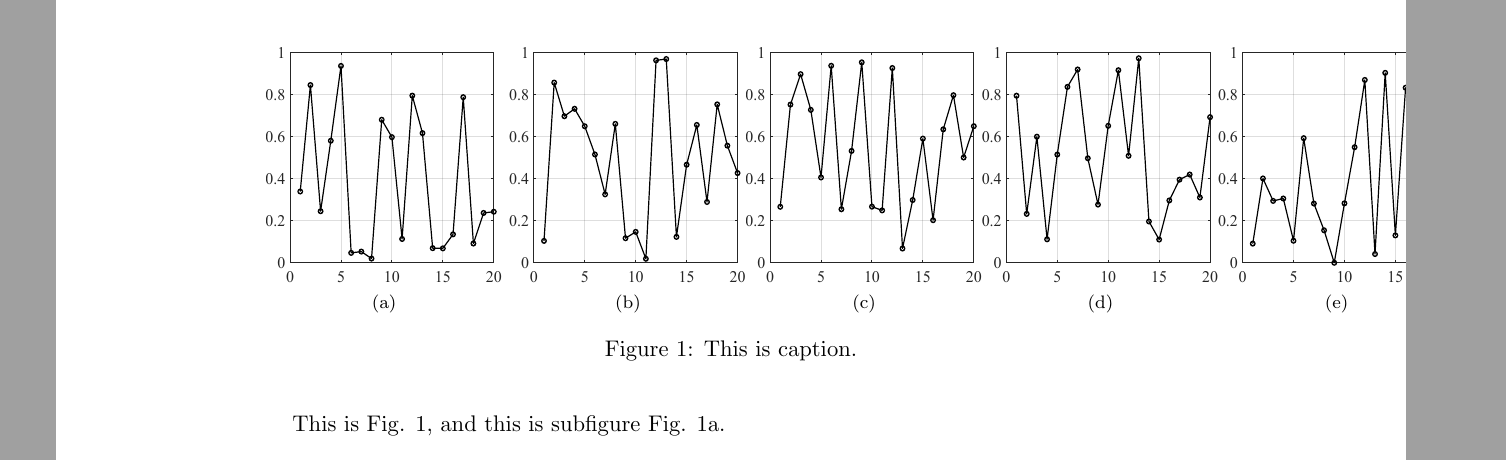
(2) The control sequence \hfill could fill the horizontal spacing between the sub-figures; on the other hand, they could arrange sub-figures automatically as well. If we delete them, these sub-figures will be ALWAYS placed in a row, although the last few sub-figures couldn’t be displayed in the page normally:
1
2
3
4
5
6
7
8
9
10
11
12
13
14
15
16
17
18
19
20
21
22
23
24
25
26
\documentclass{article}
\usepackage{graphicx,subfig}
\usepackage{geometry}
\geometry{a4paper}

\begin{document}

\begin{figure}
	\def\CE{0.25}
	\centering
	\subfloat[]{\includegraphics[height=\CE\textwidth, width=\CE\textwidth]{pic-1.pdf}
	\label{fig-a}}
	\subfloat[]{\includegraphics[height=\CE\textwidth, width=\CE\textwidth]{pic-2.pdf}}
	\subfloat[]{\includegraphics[height=\CE\textwidth, width=\CE\textwidth]{pic-3.pdf}}
	\subfloat[]{\includegraphics[height=\CE\textwidth, width=\CE\textwidth]{pic-4.pdf}}
	\subfloat[]{\includegraphics[height=\CE\textwidth, width=\CE\textwidth]{pic-5.pdf}}
	\subfloat[]{\includegraphics[height=\CE\textwidth, width=\CE\textwidth]{pic-6.pdf}}
	\subfloat[]{\includegraphics[height=\CE\textwidth, width=\CE\textwidth]{pic-7.pdf}}
	\subfloat[]{\includegraphics[height=\CE\textwidth, width=\CE\textwidth]{pic-8.pdf}}
	\caption{This is caption.}
	\label{fig}
\end{figure}

This is Fig. \ref{fig}, and this is subfigure Fig. \ref{fig-a}.

\end{document}
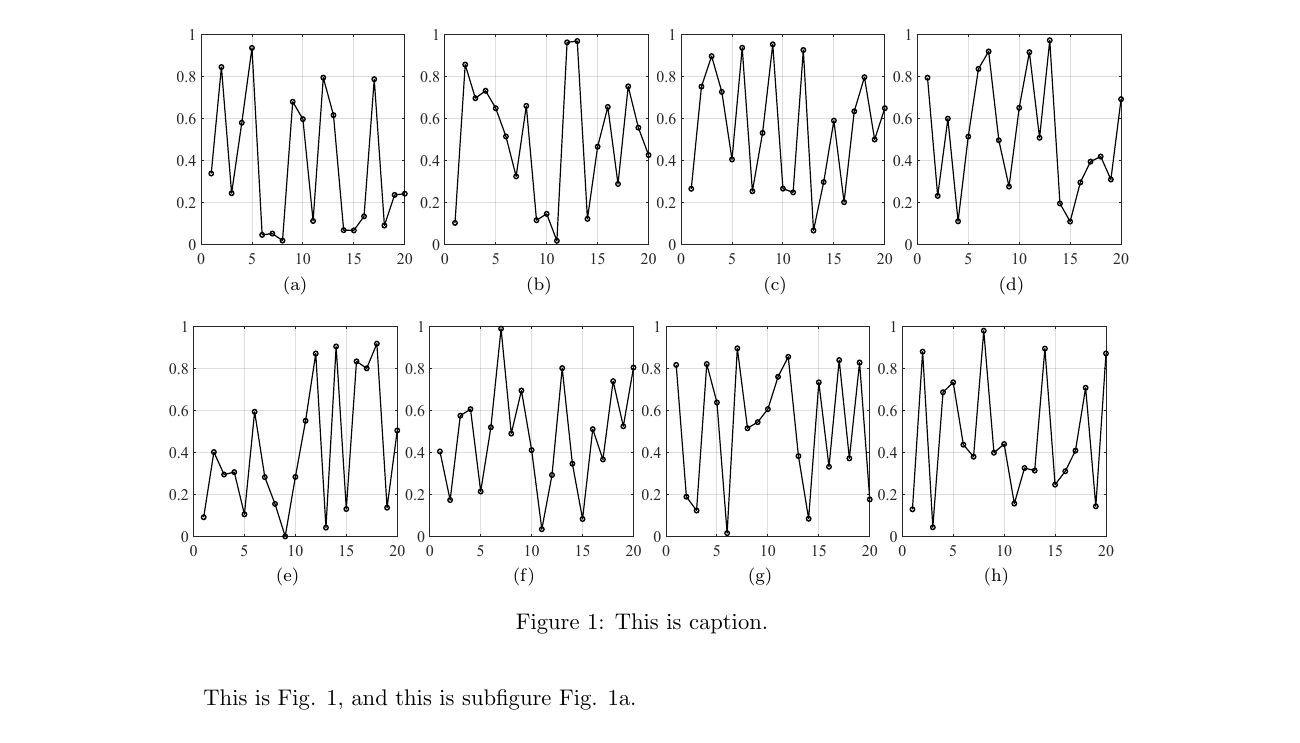
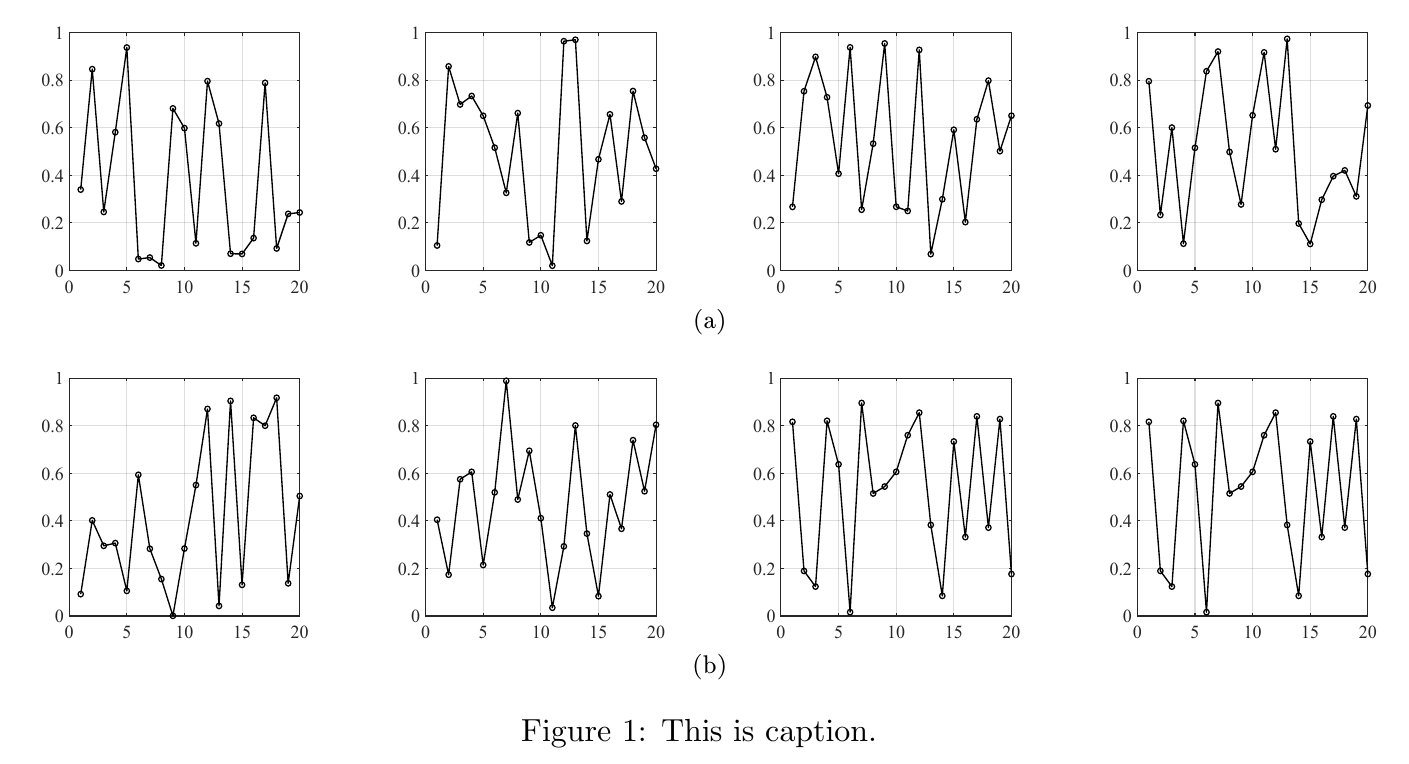
(3) If want to show the sub-figures in multiple rows, we just need to add control sequence \\ (or leave a new line with nothing) after where to split, like making a new row from the 5th sub-figure:
1
2
3
4
5
6
7
8
9
10
11
12
13
14
15
16
17
18
19
20
21
22
23
24
25
\documentclass{article}
\usepackage{graphicx,subfig}
\usepackage{geometry}
\geometry{a4paper}

\begin{document}

\begin{figure}
	\def\CE{0.25}
	\centering
	\subfloat[]{\includegraphics[height=\CE\textwidth, width=\CE\textwidth]{pic-1.pdf}\label{fig-a}}
	\subfloat[]{\includegraphics[height=\CE\textwidth, width=\CE\textwidth]{pic-2.pdf}}
	\subfloat[]{\includegraphics[height=\CE\textwidth, width=\CE\textwidth]{pic-3.pdf}}
	\subfloat[]{\includegraphics[height=\CE\textwidth, width=\CE\textwidth]{pic-4.pdf}}\\
	\subfloat[]{\includegraphics[height=\CE\textwidth, width=\CE\textwidth]{pic-5.pdf}}
	\subfloat[]{\includegraphics[height=\CE\textwidth, width=\CE\textwidth]{pic-6.pdf}}
	\subfloat[]{\includegraphics[height=\CE\textwidth, width=\CE\textwidth]{pic-7.pdf}}
	\subfloat[]{\includegraphics[height=\CE\textwidth, width=\CE\textwidth]{pic-8.pdf}}
	\caption{This is caption.}
	\label{fig}
\end{figure}

This is Fig. \ref{fig}, and this is subfigure Fig. \ref{fig-a}.

\end{document}
(4) If want to change the cross reference style of sub-figure, we could make an extra setting by \DeclareSubrefFormat and \captionsetup control sequence in preamble area, like:
1
2
3
4
5
6
7
8
9
10
11
12
13
14
15
16
17
18
19
20
21
22
23
\documentclass{article}
\usepackage{graphicx,float,subfig}
\usepackage{geometry}
\geometry{a4paper}
\DeclareSubrefFormat{myparens}{#1-(#2)}
\captionsetup[subfloat]{subrefformat=myparens}

\begin{document}

\begin{figure}
	\def\CE{0.20}
	\centering
	\subfloat[]{\includegraphics[height=\CE\textwidth, width=\CE\textwidth]{pic-1.pdf}\label{fig-a}}\hfill
	\subfloat[]{\includegraphics[height=\CE\textwidth, width=\CE\textwidth]{pic-2.pdf}}\hfill
	\subfloat[]{\includegraphics[height=\CE\textwidth, width=\CE\textwidth]{pic-3.pdf}}\hfill
	\subfloat[]{\includegraphics[height=\CE\textwidth, width=\CE\textwidth]{pic-4.pdf}}
	\caption{This is caption.}
	\label{fig}
\end{figure}

This is Fig. \ref{fig}, and this is subfigure Fig. \subref*{fig-a}.

\end{document}
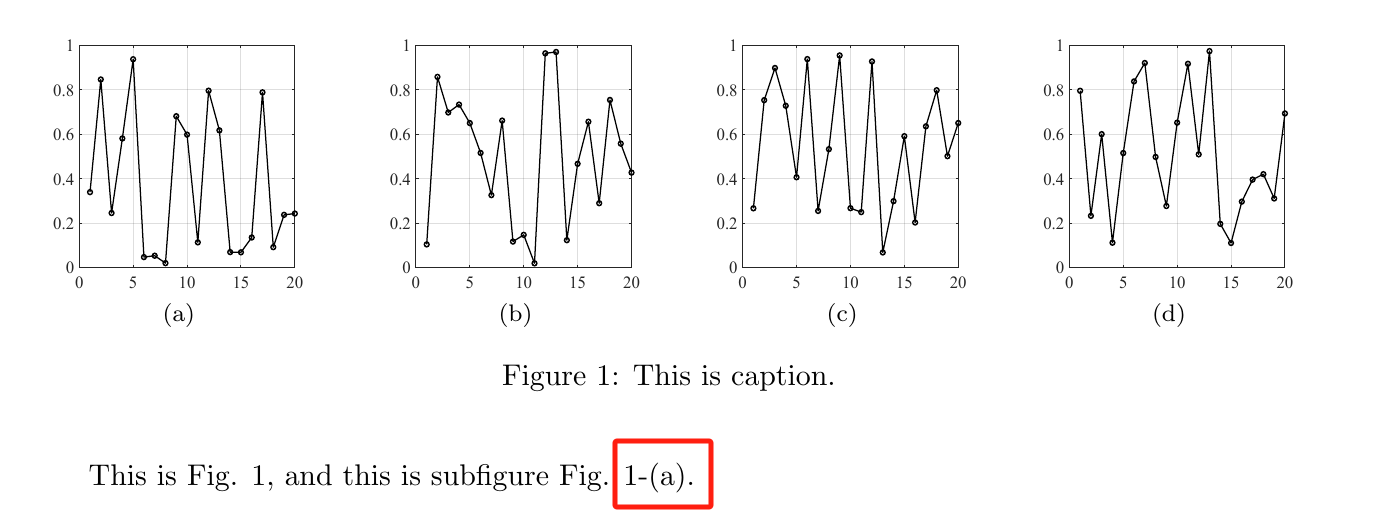
It should be noted that here, we should use \subref* to refer the label of sub-figure, and do not forget the * mark1.
(5) Multiple figures could be put into one \subfloat environment to share a sub-figure title:
1
2
3
4
5
6
7
8
9
10
11
12
13
14
15
16
17
18
19
20
21
22
23
24
25
26
27
\documentclass{article}
\usepackage{graphicx,subfig}
\usepackage{geometry}
\geometry{a4paper}

\begin{document}

\begin{figure}
	\def\CE{0.20}
	\centering
	\subfloat[]{
	\includegraphics[height=\CE\textwidth, width=\CE\textwidth]{pic-1.pdf}\label{fig-a}\hfill
	\includegraphics[height=\CE\textwidth, width=\CE\textwidth]{pic-2.pdf}\hfill
	\includegraphics[height=\CE\textwidth, width=\CE\textwidth]{pic-3.pdf}\hfill
	\includegraphics[height=\CE\textwidth, width=\CE\textwidth]{pic-4.pdf}
	}\\
	\subfloat[]{\includegraphics[height=\CE\textwidth, width=\CE\textwidth]{pic-5.pdf}}\hfill
	\subfloat[]{\includegraphics[height=\CE\textwidth, width=\CE\textwidth]{pic-6.pdf}}\hfill
	\subfloat[]{\includegraphics[height=\CE\textwidth, width=\CE\textwidth]{pic-7.pdf}}\hfill
	\subfloat[]{\includegraphics[height=\CE\textwidth, width=\CE\textwidth]{pic-8.pdf}}\hfill
	\caption{This is caption.}
	\label{fig}
\end{figure}

This is Fig. \ref{fig}, and this is subfigure Fig. \ref{fig-a}.

\end{document}
It can be seen from this example that the \fill doesn’t work in \subfloat environment.
minipage + \includegraphics
Using minipage environment is another way to organize figures, and I think this is a better approach as it is convenient for sub-figures to share a label horizontally or vertically:
1
2
3
4
5
6
7
8
9
10
11
12
13
14
15
16
17
18
19
20
21
22
23
24
25
26
27
28
29
30
31
32
33
\documentclass{article}
\usepackage{graphicx,subfig}
\usepackage{geometry}
\geometry{a4paper}

\begin{document}

\begin{figure}
	\def\CE{0.20}
	\centering
	\subfloat[]{
		\begin{minipage}{\linewidth}
		\centering
		\includegraphics[height=\CE\textwidth, width=\CE\textwidth]{pic-1.pdf}\hfill
		\includegraphics[height=\CE\textwidth, width=\CE\textwidth]{pic-2.pdf}\hfill
		\includegraphics[height=\CE\textwidth, width=\CE\textwidth]{pic-3.pdf}\hfill
		\includegraphics[height=\CE\textwidth, width=\CE\textwidth]{pic-4.pdf}
		\end{minipage}
	}\\
	\subfloat[]{
		\begin{minipage}{\linewidth}
		\centering
		\includegraphics[height=\CE\textwidth, width=\CE\textwidth]{pic-5.pdf}\hfill
		\includegraphics[height=\CE\textwidth, width=\CE\textwidth]{pic-6.pdf}\hfill
		\includegraphics[height=\CE\textwidth, width=\CE\textwidth]{pic-7.pdf}\hfill
		\includegraphics[height=\CE\textwidth, width=\CE\textwidth]{pic-7.pdf}
		\end{minipage}
	}
	\caption{This is caption.}
	\label{fig}
\end{figure}

\end{document}
1
2
3
4
5
6
7
8
9
10
11
12
13
14
15
16
17
18
19
20
21
22
23
24
25
26
27
28
29
30
31
32
33
34
35
36
37
38
39
40
41
42
43
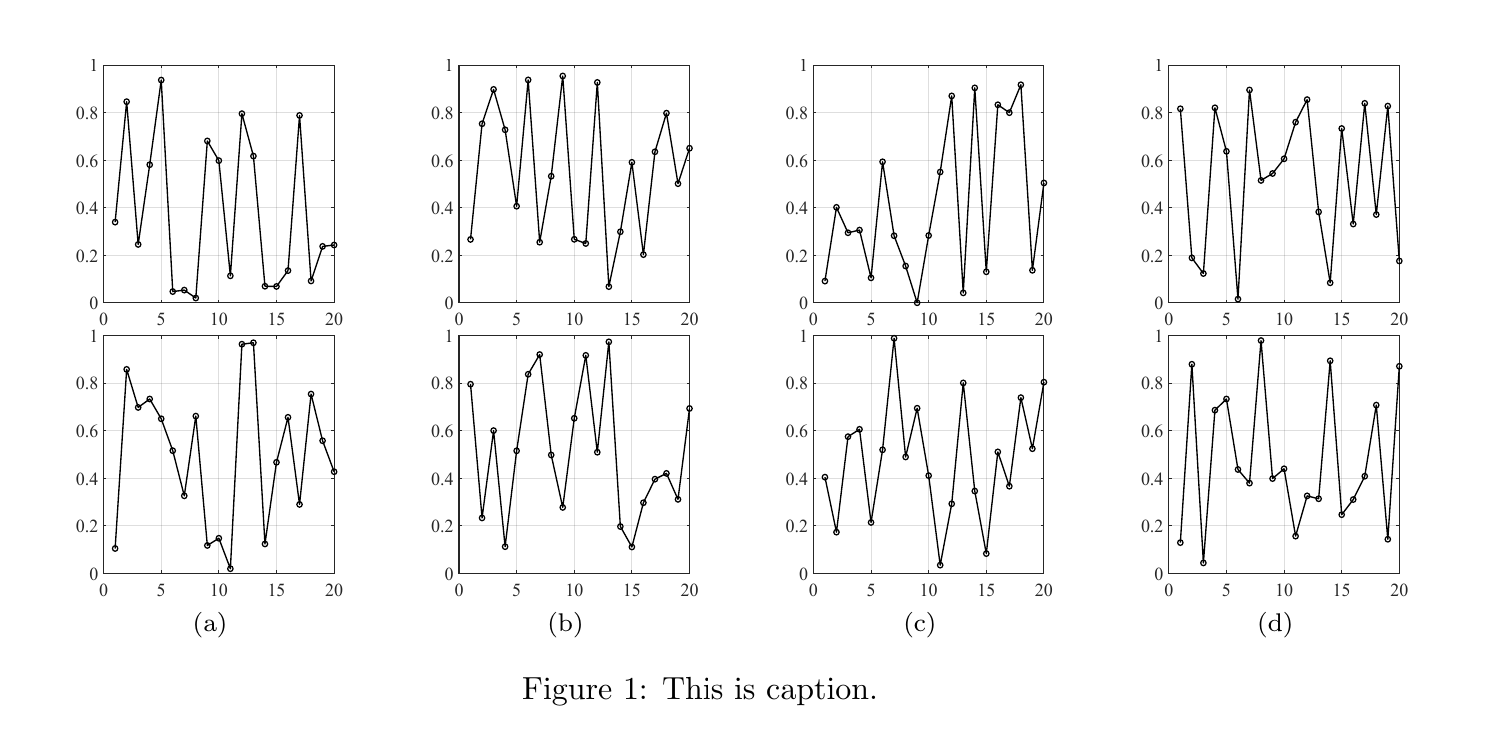
\documentclass{article}
\usepackage{graphicx,subfig}
\usepackage{geometry}
\geometry{a4paper}
\begin{document}
\begin{figure}
\def\CE{0.8}
\centering
\subfloat[]{
\begin{minipage}{0.25\textwidth}
\centering
\includegraphics[height=\CE\textwidth, width=\CE\textwidth]{pic-1.pdf}\\
\includegraphics[height=\CE\textwidth, width=\CE\textwidth]{pic-2.pdf}
\end{minipage}
}
\subfloat[]{
\begin{minipage}{0.25\textwidth}
\centering
\includegraphics[height=\CE\textwidth, width=\CE\textwidth]{pic-3.pdf}\\
\includegraphics[height=\CE\textwidth, width=\CE\textwidth]{pic-4.pdf}
\end{minipage}
}
\subfloat[]{
\begin{minipage}{0.25\textwidth}
\centering
\includegraphics[height=\CE\textwidth, width=\CE\textwidth]{pic-5.pdf}\\
\includegraphics[height=\CE\textwidth, width=\CE\textwidth]{pic-6.pdf}
\end{minipage}
}
\subfloat[]{
\begin{minipage}{0.25\textwidth}
\centering
\includegraphics[height=\CE\textwidth, width=\CE\textwidth]{pic-7.pdf}\\
\includegraphics[height=\CE\textwidth, width=\CE\textwidth]{pic-8.pdf}
\end{minipage}
}
\caption{This is caption.}
\label{fig}
\end{figure}
\end{document}
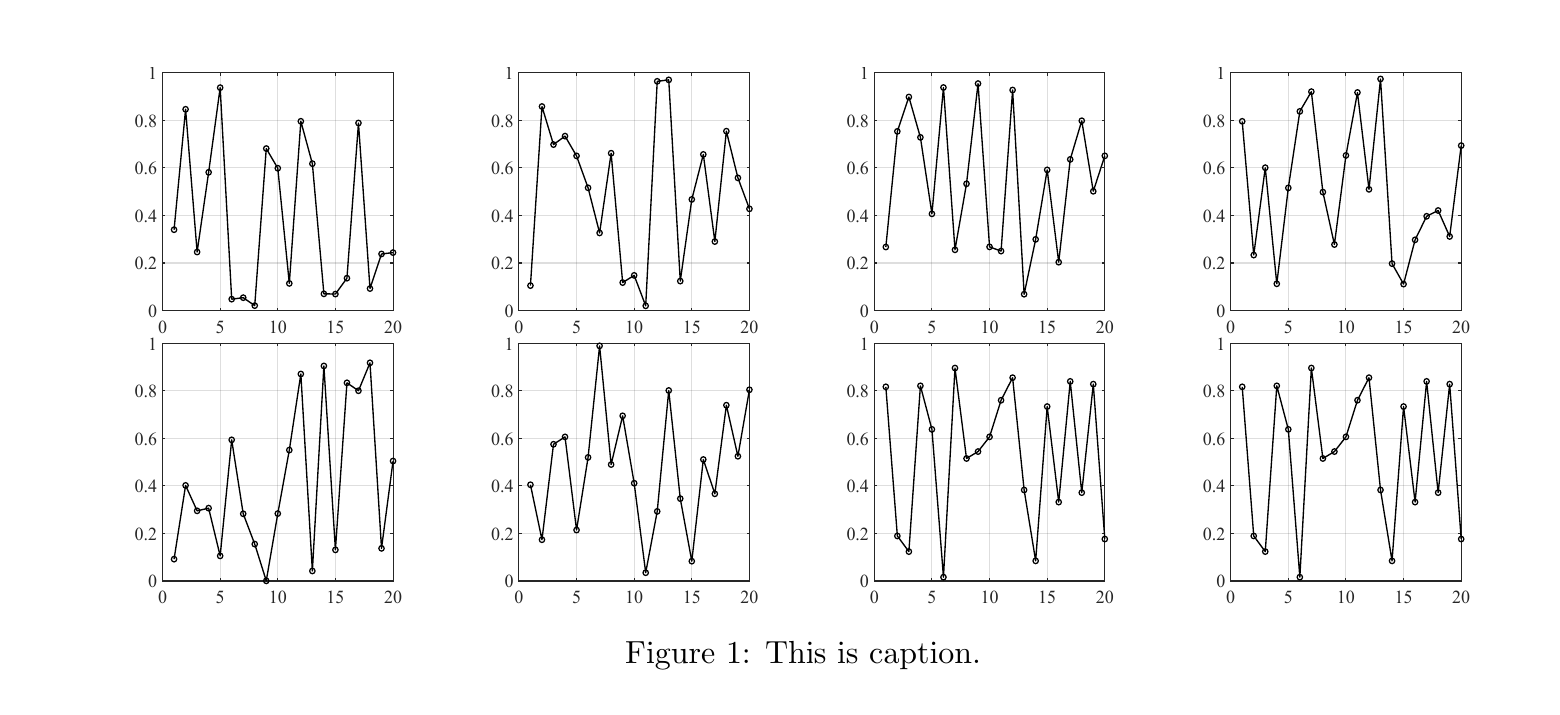
Note well here that the minipage environment must be include in \subfloat as well, otherwise the sub-figure won’t appear:
1
2
3
4
5
6
7
8
9
10
11
12
13
14
15
16
17
18
19
20
21
22
23
24
25
26
27
28
29
\documentclass{article}
\usepackage{graphicx,subfig}
\usepackage{geometry}
\geometry{a4paper}

\begin{document}

\begin{figure}
	\def\CE{0.20}
	\centering
	\begin{minipage}{\linewidth}
	\centering
	\includegraphics[height=\CE\textwidth, width=\CE\textwidth]{pic-1.pdf}\hfill
	\includegraphics[height=\CE\textwidth, width=\CE\textwidth]{pic-2.pdf}\hfill
	\includegraphics[height=\CE\textwidth, width=\CE\textwidth]{pic-3.pdf}\hfill
	\includegraphics[height=\CE\textwidth, width=\CE\textwidth]{pic-4.pdf}
	\end{minipage}\\
	\begin{minipage}{\linewidth}
	\centering
	\includegraphics[height=\CE\textwidth, width=\CE\textwidth]{pic-5.pdf}\hfill
	\includegraphics[height=\CE\textwidth, width=\CE\textwidth]{pic-6.pdf}\hfill
	\includegraphics[height=\CE\textwidth, width=\CE\textwidth]{pic-7.pdf}\hfill
	\includegraphics[height=\CE\textwidth, width=\CE\textwidth]{pic-7.pdf}
	\end{minipage}
	\caption{This is caption.}
	\label{fig}
\end{figure}

\end{document}
Actually, in the previous part, the reason why we put \includegraphics in \subfloat is the same, if we just use \includegraphics control sequence:
1
2
3
4
5
6
7
8
9
10
11
12
13
14
15
16
17
18
19
\documentclass{article}
\usepackage{graphicx,subfig}
\usepackage{geometry}
\geometry{a4paper}

\begin{document}

\begin{figure}
	\def\CE{0.20}
	\centering
	\includegraphics[height=\CE\textwidth, width=\CE\textwidth]{pic-1.pdf}\label{fig-a}\hfill
	\includegraphics[height=\CE\textwidth, width=\CE\textwidth]{pic-2.pdf}\hfill
	\includegraphics[height=\CE\textwidth, width=\CE\textwidth]{pic-3.pdf}\hfill
	\includegraphics[height=\CE\textwidth, width=\CE\textwidth]{pic-4.pdf}\hfill
	\caption{This is caption.}
	\label{fig}
\end{figure}

\end{document}
subfigure (subcaption package) + \includegraphics
Besides, we can also put \includegraphics command in the subfigure environment provided by the subcaption package2:
1
2
3
4
5
6
7
8
9
10
11
12
13
14
15
16
17
18
19
20
21
22
23
24
25
26
27
28
29
30
31
32
33
34
35
36
37
38
39
40
41
42
43
44
45
46
47
48
49
50
51
52
53
54
55
56
57
58
59
60
61
62
63
\documentclass[a4paper]{article}
\usepackage{lipsum}
\usepackage{graphicx,subcaption}
\begin{document}
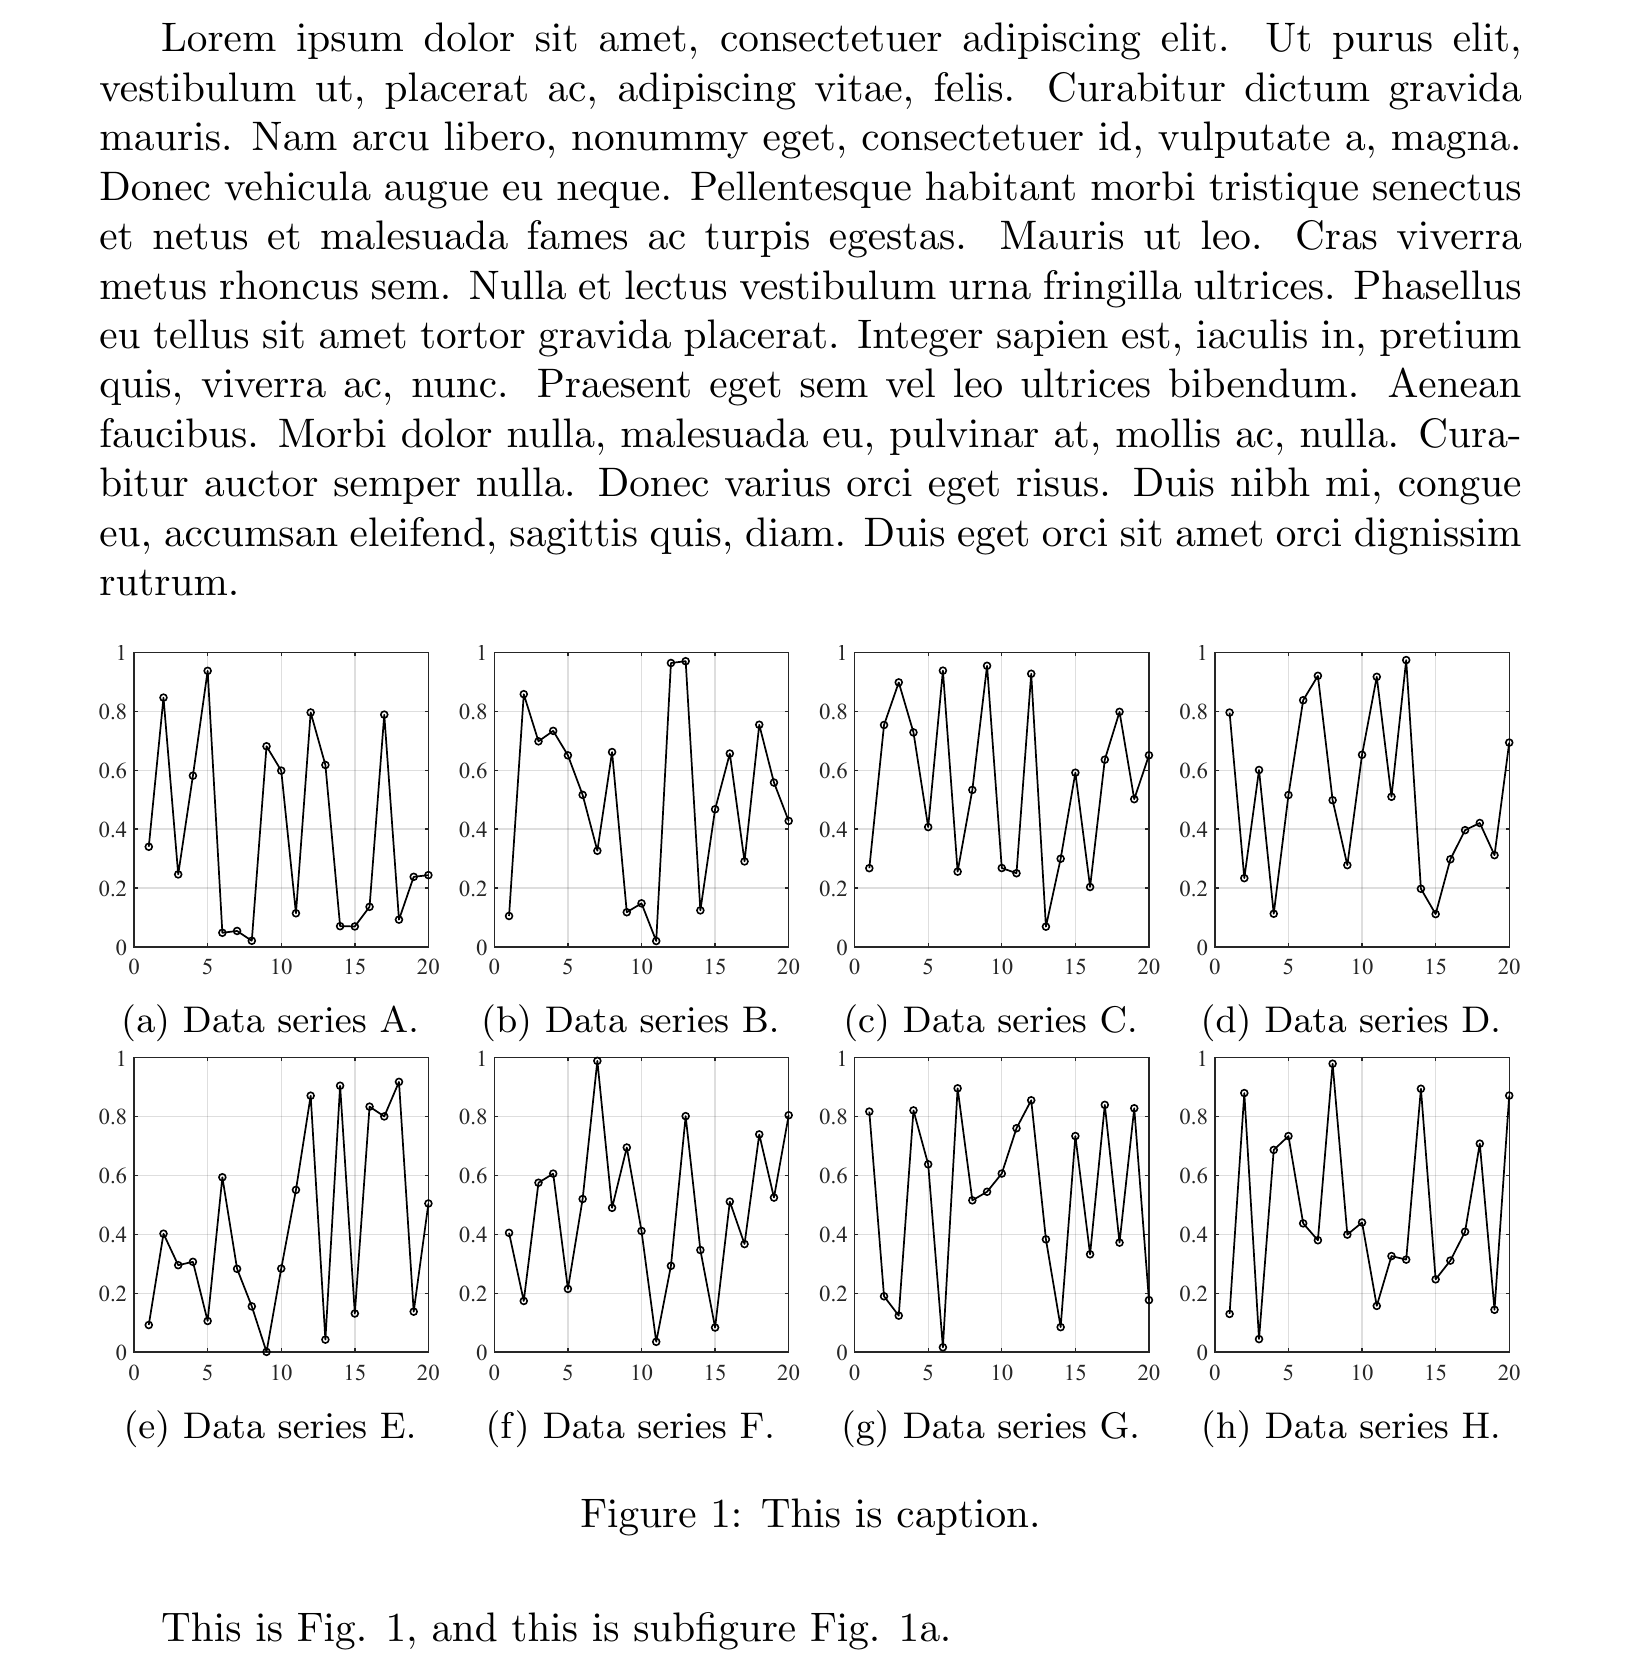
\lipsum[1]
\begin{figure}[h!]
\def\CE{0.24}
\centering
\begin{subfigure}[b]{\CE\textwidth}
\includegraphics[width=\textwidth]{pic-1.pdf}
\caption{Data series A.}
\label{fig-a}
\end{subfigure}
\hfill
\begin{subfigure}[b]{\CE\textwidth}
\includegraphics[width=\textwidth]{pic-2.pdf}
\caption{Data series B.}
\label{fig-b}
\end{subfigure}
\hfill
\begin{subfigure}[b]{\CE\textwidth}
\includegraphics[width=\textwidth]{pic-3.pdf}
\caption{Data series C.}
\label{fig-c}
\end{subfigure}
\hfill
\begin{subfigure}[b]{\CE\textwidth}
\includegraphics[width=\textwidth]{pic-4.pdf}
\caption{Data series D.}
\label{fig-d}
\end{subfigure}\\
\begin{subfigure}[b]{\CE\textwidth}
\includegraphics[width=\textwidth]{pic-5.pdf}
\caption{Data series E.}
\label{fig-e}
\end{subfigure}
\hfill
\begin{subfigure}[b]{\CE\textwidth}
\includegraphics[width=\textwidth]{pic-6.pdf}
\caption{Data series F.}
\label{fig-f}
\end{subfigure}
\hfill
\begin{subfigure}[b]{\CE\textwidth}
\includegraphics[width=\textwidth]{pic-7.pdf}
\caption{Data series G.}
\label{fig-G}
\end{subfigure}
\hfill
\begin{subfigure}[b]{\CE\textwidth}
\includegraphics[width=\textwidth]{pic-8.pdf}
\caption{Data series H.}
\label{fig-H}
\end{subfigure}
\caption{This is caption.}
\label{fig}
\end{figure}
This is Fig. \ref{fig}, and this is subfigure Fig. \ref{fig-a}.
\end{document}
However, the subcaption package is sometimes not compatible with some templates, most importantly IEEETran for me, and the subfig package, i.e., using \subfloat command as introduced above, can be used instead2:
A useful extension is the subcaption package, which uses subfloats within a single float. The subfig package (subfigure package is deprecated) is a useful alternative when used in conjunction with LaTeX templates (i.e. templates for journals from Springer and IOP, IEEETran and ACM SIG) that are not compatible with subcaption.
References