Only Show Partial Legends When Plotting Lines in MATLAB
"HandleVisibility" property of Line object
When plotting lines in MATLAB, sometimes we don’t need to display all the legends of lines. I find some methods on the Internet to meet this requirement, and among which I think the most suitable way is specifying the "handlevisibility" property of Line object. For example, we could hide the legend of the second green line by the following code:
1
2
3
4
5
6
7
8
9
10
11
12
13
14
15
16
17
18
clc, clear, close all

rng("default")

x = 1:20;
y1 = randn(1, 20);
y2 = randn(1, 20);
y3 = randn(1, 20);

figure
nexttile
hold(gca, "on")
box(gca, "on")
LineWidth = 1.5;
plot(x, y1, "LineWidth", LineWidth, "Color", 'r')
plot(x, y2, "LineWidth", LineWidth, "Color", 'g', "HandleVisibility", 'off')
plot(x, y3, "LineWidth", LineWidth, "Color", 'b')
legend("y1", "y3")

Label lines by groups
Added on Nov. 14, 2023.
Sometimes, we need to group lines, and label each group using one legend. Before, I liked to use "DisplayName" property to add legend for a single line in each group, and use "HandleVisibility" property to hide others, and finally, using legend() function to display legends. For example:
1
2
3
4
5
6
7
8
9
10
11
12
13
14
15
16
17
18
19
20
21
22
23
24
25
26
27
28
29
clc,clear,close all
rng("default")

dataLength = 10;
t = 1:dataLength;
numPerClass = [7,7,7];
data = randn(sum(numPerClass),dataLength);
labels = [repmat("a",numPerClass(1),1);
    repmat("b",numPerClass(2),1);
    repmat("c",numPerClass(3),1)];
Classes = unique(labels);

colors = ["r","g","b"];
figure
hold(gca,"on"),box(gca,"on"),grid(gca,"on")
for i = 1:numel(Classes)
    data_per_class = data(labels==Classes(i),:);
    for j = 1:height(data_per_class)
        if j == 1
            plot(t,data_per_class(j,:),"Color",colors(i),"LineWidth",1.5, ...
                "DisplayName",sprintf("Class %s",Classes(i)))
        else
            plot(t,data_per_class(j,:), ...
                "Color",colors(i),"LineWidth",1.5, ...
                "HandleVisibility","off")
        end
    end
end
legend();
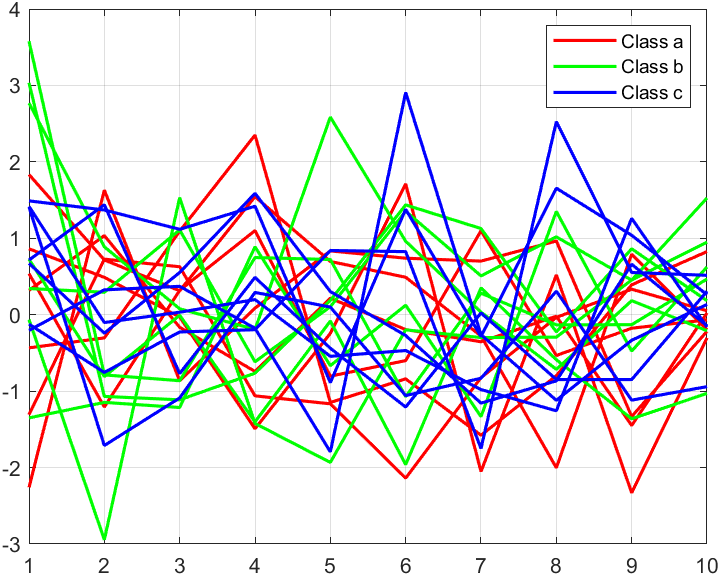
It could realize our goals, but it is also kinda ugly. Recently, I’ve been learning MATLAB built-in function andrewsplot 1, and I find it realizing this point by preallocating a GraphicsPlaceholder class variable (by gobjects function 2) and then assigning a Line object of each group, which is much better. The specific code is like:
1
2
3
4
5
6
7
8
9
10
11
12
13
14
15
16
17
18
19
20
21
22
23
24
25
26
27
28
clc,clear,close all

rng("default")

dataLength = 10;
t = 1:dataLength;
numPerClass = [7,7,7];
data = randn(sum(numPerClass),dataLength);
labels = [repmat("a",numPerClass(1),1);
    repmat("b",numPerClass(2),1);
    repmat("c",numPerClass(3),1)];
Classes = unique(labels);

colors = ["r","g","b"];
figure
hold(gca,"on"),box(gca,"on"),grid(gca,"on")

% Initialize array for graphics objects with legends
legendh = gobjects(numel(Classes),1);

for i = 1:numel(Classes)
    data_per_class = data(labels==Classes(i),:);
    lines = plot(t,data_per_class,"Color",colors(i),"LineWidth",1.5);

    % Store the line object needing legend
    legendh(i) = lines(1);
end
legend(legendh,Classes);
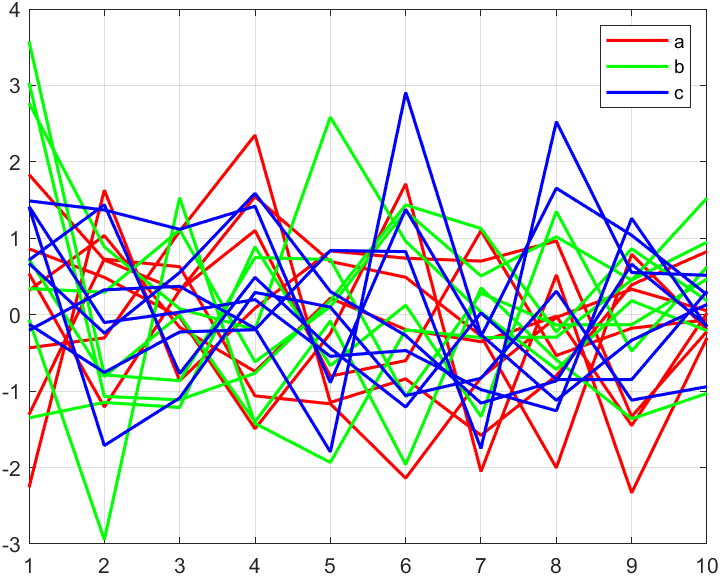
The result is the same as that generated by Script 1, but definitely, Script 2 will significantly reduce the code running time especially when the number of lines is very large, because this script avoids many for loops and if statements.
On another hand, no matter in Script 1 or Script 2, we all need to specify a uniform color for lines belonging to each group, so we should define a color list in advance, like:
1
colors = ["r","g","b"];
It is okay, but as the number of group increases, it is kinda hard to think about many color names or specific RGB-tuples. Of course, if we want to improve the figure style, specifying RGB-tuples carefully is rather necessary, but at the beginning stage, using built-in colors is a not bad choice. Regarding this point, andrewsplot 1 function also provides an effective approach, that is using get method to obtain the "ColorOrder" property, i.e., default color list, of the axes. By this way, we could modify Script 2 to:
1
2
3
4
5
6
7
8
9
10
11
12
13
14
15
16
17
18
19
20
21
22
23
24
25
26
27
28
29
30
31
32
clc,clear,close all

rng("default")

dataLength = 10;
t = 1:dataLength;
numPerClass = [7,7,7];
data = randn(sum(numPerClass),dataLength);
labels = [repmat("a",numPerClass(1),1);
    repmat("b",numPerClass(2),1);
    repmat("c",numPerClass(3),1)];
Classes = unique(labels);

figure
hold(gca,"on"),box(gca,"on"),grid(gca,"on")

% Obtain buit-in color list
colors = get(gca,"ColorOrder");

% Initialize array for graphics objects with legends
legendh = gobjects(numel(Classes),1);

for i = 1:numel(Classes)
	colorIdx = mod(i-1,height(colors))+1;
    color = colors(colorIdx,:);
    data_per_class = data(labels==Classes(i),:);
    lines = plot(t,data_per_class,"Color",color,"LineWidth",1.5);

    % Store the line object needing legend
    legendh(i) = lines(1);
end
legend(legendh,Classes);
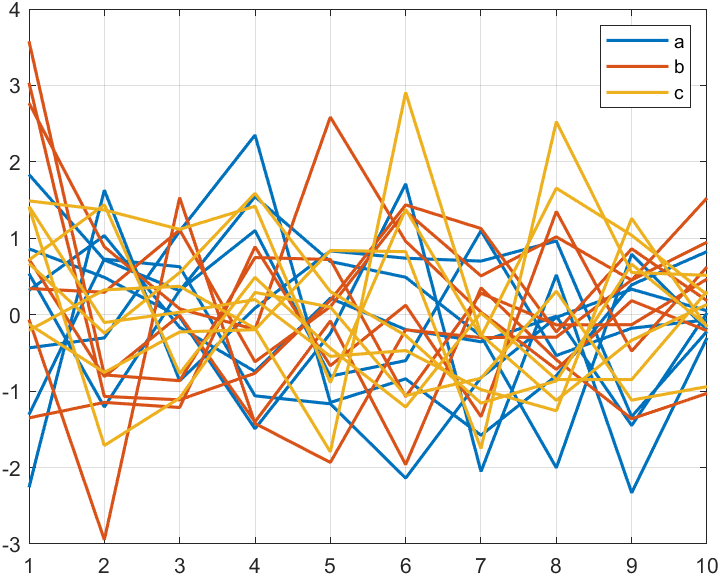
And a more inspiring aspect in this script is that we could use modulo operation 3:
1
color = colors(mod(i-1,height(colors))+1,:); % the number of colors, i.e.,height(colors), at this case is 7.
to determine the color for representing $i$-th group, cause we don’t need to concern the case that the number of groups exceeds the number of colors: the modulo operation will make a loop. For example:
Index of Group (i) |
1 | 2 | 3 | 4 | 5 | 6 | 7 | 8 | 9 | 10 | 11 | 12 | 13 | 14 | 15 | 16 | 17 | 18 | 19 | 20 | 21 |
|---|---|---|---|---|---|---|---|---|---|---|---|---|---|---|---|---|---|---|---|---|---|
i-1 |
0 | 1 | 2 | 3 | 4 | 5 | 6 | 7 | 8 | 9 | 10 | 11 | 12 | 13 | 14 | 15 | 16 | 17 | 18 | 19 | 20 |
The Number of Color height(colors) |
7 | 7 | 7 | 7 | 7 | 7 | 7 | 7 | 7 | 7 | 7 | 7 | 7 | 7 | 7 | 7 | 7 | 7 | 7 | 7 | 7 |
mod(i-1,height(colors) |
0 | 1 | 2 | 3 | 4 | 5 | 6 | 0 | 1 | 2 | 3 | 4 | 5 | 6 | 0 | 1 | 2 | 3 | 4 | 5 | 6 |
Index of Color mod(i-1,height(colors))+1 |
1 | 2 | 3 | 4 | 5 | 6 | 7 | 1 | 2 | 3 | 4 | 5 | 6 | 7 | 1 | 2 | 3 | 4 | 5 | 6 | 7 |
References