Fill the Area Between Two Lines in MATLAB — A helper function for fill and fill3
In a previous blog1, I ever recorded a method to fill the interval area using MATLAB fill function. Actually, this fill function2 is not specially designed for filling the area between two lines (it’s for plotting shapes, by specifying and then connecting the end points one by one. It makes sense). So, recently when I used fill function to fill the area between two lines, I found the syntax is not that direct, because I have to make an end-to-end connection between two curves, with the help of flipud or fliprl function (depending on whether column or row vector). So, in this blog, I want to record a small helper function here, which takes the x- and y-coordinates of two lines, a more straightforward syntax, to help me use fill function (and similar fill3 function 3 that is used in 3D plot) in the future.
(1) fill version
1
2
3
4
function helperFill(xU, yU, xL, yL, Color)
data = [xU, yU; flipud([xL, yL])];
fill(data(:, 1), data(:, 2), Color, 'EdgeColor', 'none', 'FaceAlpha', 0.2, 'HandleVisibility', 'off');
end
(2) fill3 version
1
2
3
4
function helperFill3(xU, yU, zU, xL, yL, zL, Color)
data = [xU, yU, zU; flipud([xL, yL, zL])];
fill3(data(:, 1), data(:, 2), data(:, 3), Color, 'EdgeColor', 'none', 'FaceAlpha', 0.2, 'HandleVisibility', 'off');
end
and we can use it like (note that all coordinate variables should be column vector):
1
2
3
4
5
6
7
8
9
10
11
12
13
14
15
16
17
18
19
20
21
22
23
24
25
26
27
28
29
30
31
32
33
34
35
36
37
38
39
40
41
42
43
44
45
46
47
48
clc, clear, close all
figure('Color', 'w', 'Position', [1000,736,863,501])
tiledlayout(1, 2, 'TileSpacing', 'tight')
nexttile
hold(gca, 'on')
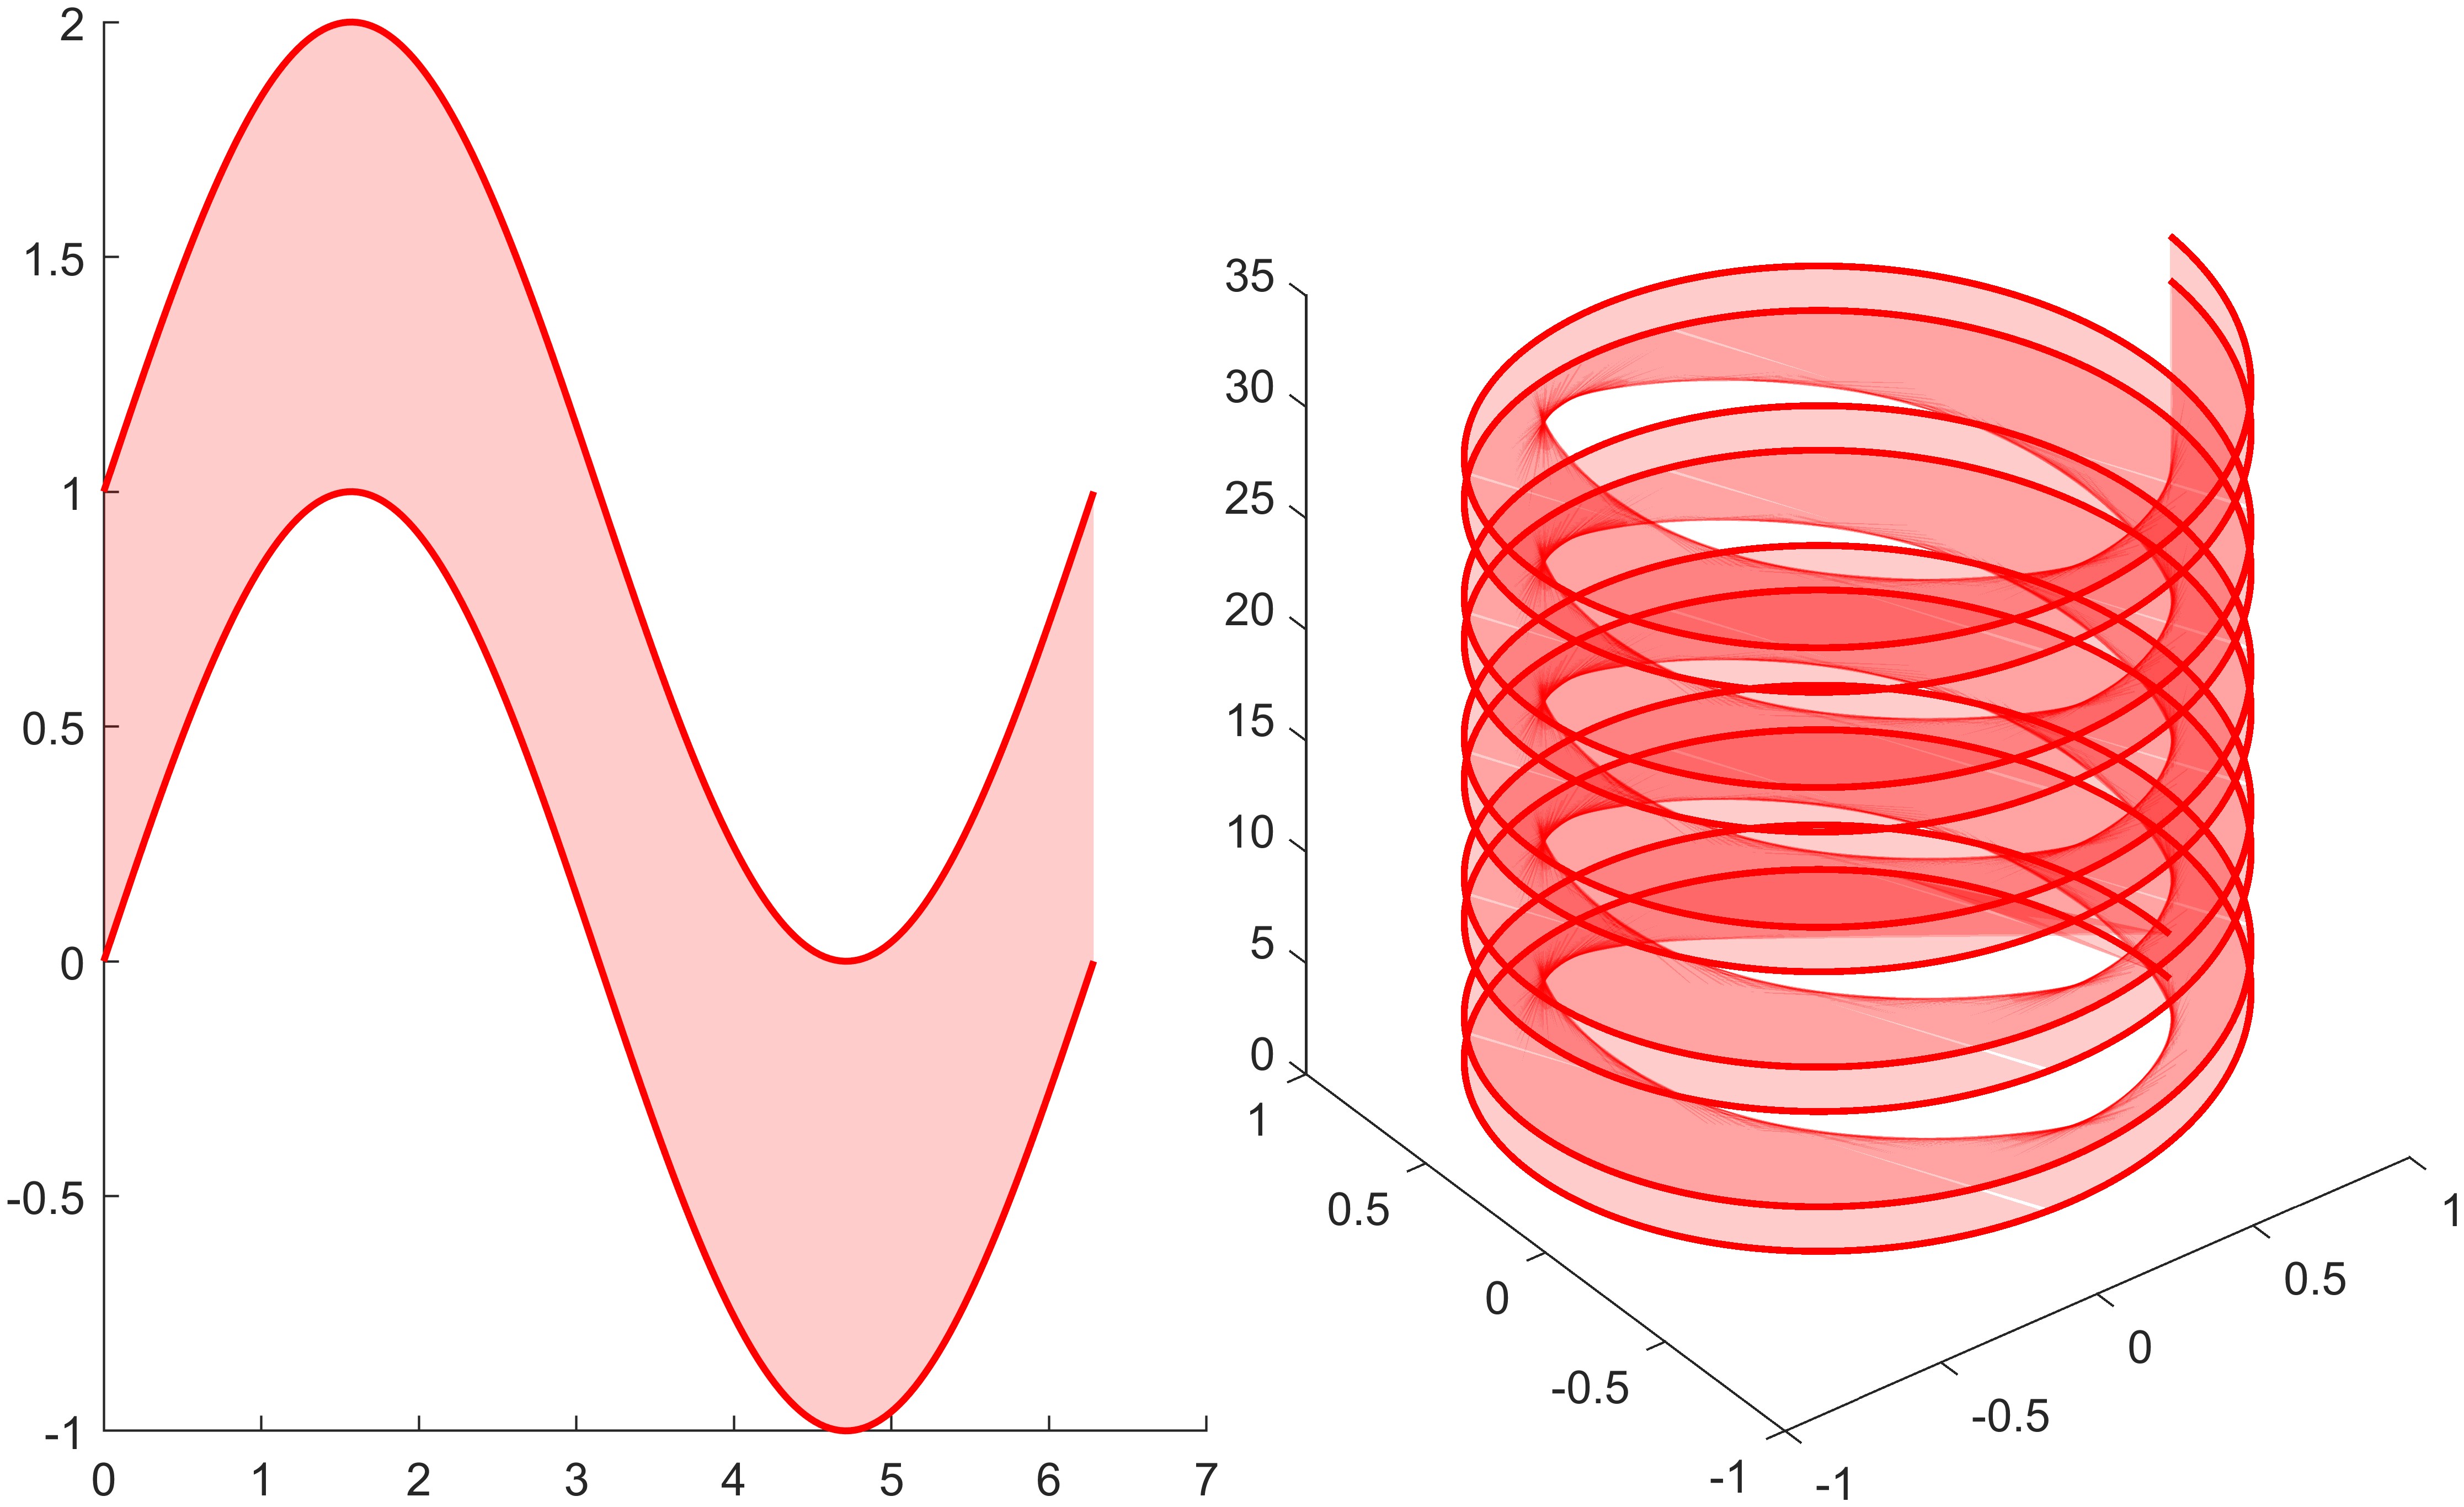
x = linspace(0, 2*pi, 200);
y1 = sin(x);
y2 = sin(x)+1;
x = x';
y1 = y1';
y2 = y2';
plot(x, y1, 'LineWidth', 1.5, 'Color', 'r')
plot(x, y2, 'LineWidth', 1.5, 'Color', 'r')
helperFill(x, y1, x, y2, 'r')
nexttile
view(3)
hold(gca, 'on')
t = linspace(0, 10*pi, 2e3);
x = cos(t);
y = sin(t);
z1 = t;
z2 = t+2;
x = x';
y = y';
z1 = z1';
z2 = z2';
plot3(x, y, z1, 'LineWidth', 1.5, 'Color', 'r')
plot3(x, y, z2, 'LineWidth', 1.5, 'Color', 'r')
helperFill3(x, y, z1, x, y, z2, 'r')
exportgraphics(gcf, 'fig.jpg', 'Resolution', 600)
function helperFill(xU, yU, xL, yL, Color)
data = [xU, yU; flipud([xL, yL])];
fill(data(:, 1), data(:, 2), Color, 'EdgeColor', 'none', 'FaceAlpha', 0.2, 'HandleVisibility', 'off');
end
function helperFill3(xU, yU, zU, xL, yL, zL, Color)
data = [xU, yU, zU; flipud([xL, yL, zL])];
fill3(data(:, 1), data(:, 2), data(:, 3), Color, 'EdgeColor', 'none', 'FaceAlpha', 0.2, 'HandleVisibility', 'off');
end
References