Plot Coordinates Using LaTeX TikZ
Nov. 09, 2025 in Buffalo, United States • Updated Nov. 10, 2025
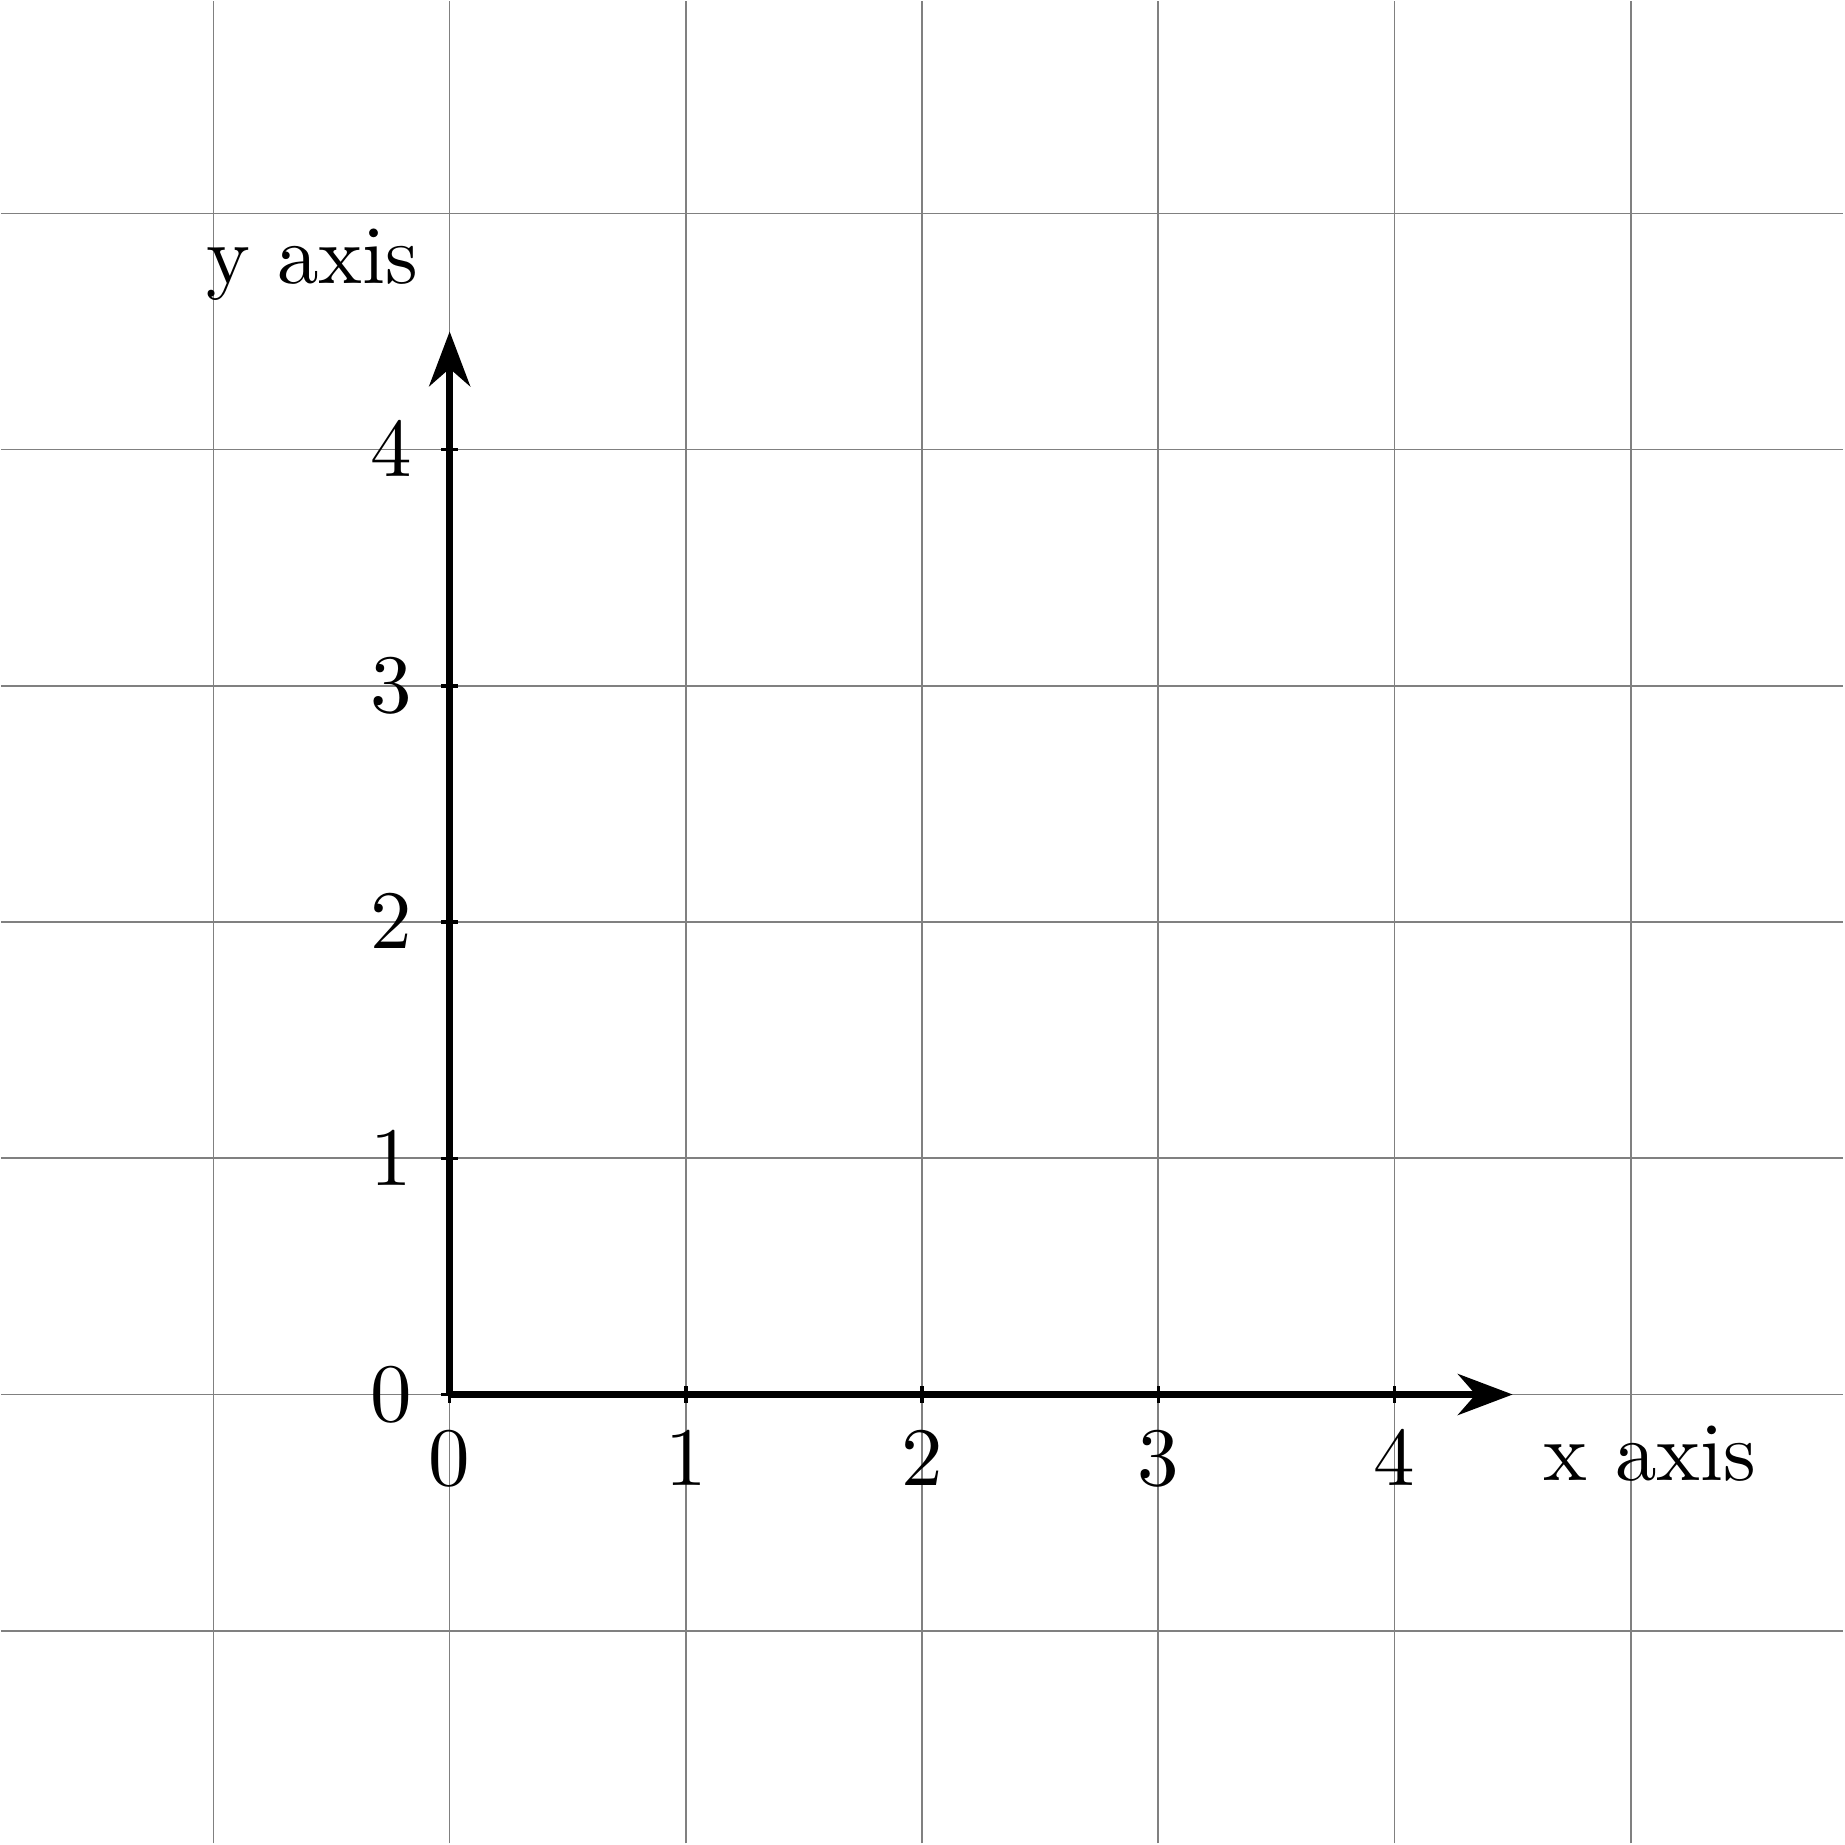
Sometimes, I want to plot coordinates using LaTeX TikZ, but before I didn’t find a fixed method that I can reuse it in the future. I ever recorded a way in blog1, but it’s sort of complicated and seems not suitable for figures to be inserted in papers. Today, I saw an Overleaf blog2 that introduces a method. Actually, it is very easy, just using two \draw commands (and \foreach if numerical x-label needed), and I’m very sure I ever used this way, but every time I need to plot coordinates, I always think if there is a more professional command to realize. But in fact, it’s unnecessary. So, I’d like to record it in this blog to remind me in the future. Here is the whole script, nothing big:
1
2
3
4
5
6
7
8
9
10
11
12
13
14
15
16
\documentclass[tikz]{standalone}
\usetikzlibrary{arrows.meta}

\begin{document}
\begin{tikzpicture}[>=Stealth]
	\draw[step=1cm,gray,very thin] (-1.9,-1.9) grid (5.9,5.9); % Background grid if needed

	\draw[thick,->] (0,0) -- (4.5,0) node[anchor=north west] {x axis};
	\draw[thick,->] (0,0) -- (0,4.5) node[anchor=south east] {y axis};
	\foreach \x in {0,1,2,3,4}
	\draw (\x cm,1pt) -- (\x cm,-1pt) node[anchor=north] {$\x$};
	\foreach \y in {0,1,2,3,4}
	\draw (1pt,\y cm) -- (-1pt,\y cm) node[anchor=east] {$\y$};
\end{tikzpicture}

\end{document}
References