Organize Multiple Subfigures Like MATLAB tiledlayout Function in LaTeX
Oct. 21, 2025 in United States • Updated Oct. 21, 2025
In MALTAB, we can use the function tiledlayout1 to organize multiple subplots in one layout. In LaTeX, we can realize a similar effect using minipage environment and \subfloat command (package subfig is needed. See blog2):
1
2
3
4
5
6
7
8
9
10
11
12
13
14
15
16
17
18
19
20
21
22
23
24
25
26
27
28
29
30
31
32
33
\documentclass{article}
\usepackage[margin=1in]{geometry}
\usepackage{graphicx,subfig}

\begin{document}

\begin{figure*}[htp]
\centering
	% Fig 1
	\begin{minipage}{0.32\linewidth}
		\subfloat[xxx]{\includegraphics[width=\linewidth]{fig1.jpg}}
	\end{minipage}\hfill
	% Fig 2
	\begin{minipage}{0.32\linewidth}
		\subfloat[xxx]{\includegraphics[width=\linewidth]{fig2.jpg}}
	\end{minipage}\hfill
	% Fig 3
	\begin{minipage}{0.32\linewidth}
		\subfloat[xxx]{\includegraphics[width=\linewidth]{fig3.jpg}}
	\end{minipage}\hfill
	\vspace*{1em}
	% Fig 3 & Fig 4 (NOTE HERE, two figures are put in one minipage)
	\begin{minipage}{0.32\linewidth}
		\subfloat[xxx]{\includegraphics[width=\linewidth]{fig4.jpg}}\\
		\subfloat[xxx]{\includegraphics[width=\linewidth]{fig5.jpg}}
	\end{minipage}\hfill
	\begin{minipage}{0.67\linewidth}
		\vspace*{1.5em}
		\subfloat[xxx]{\includegraphics[width=\linewidth]{fig6.jpg}}
	\end{minipage}
\caption{xxx}
\end{figure*}
\end{document}
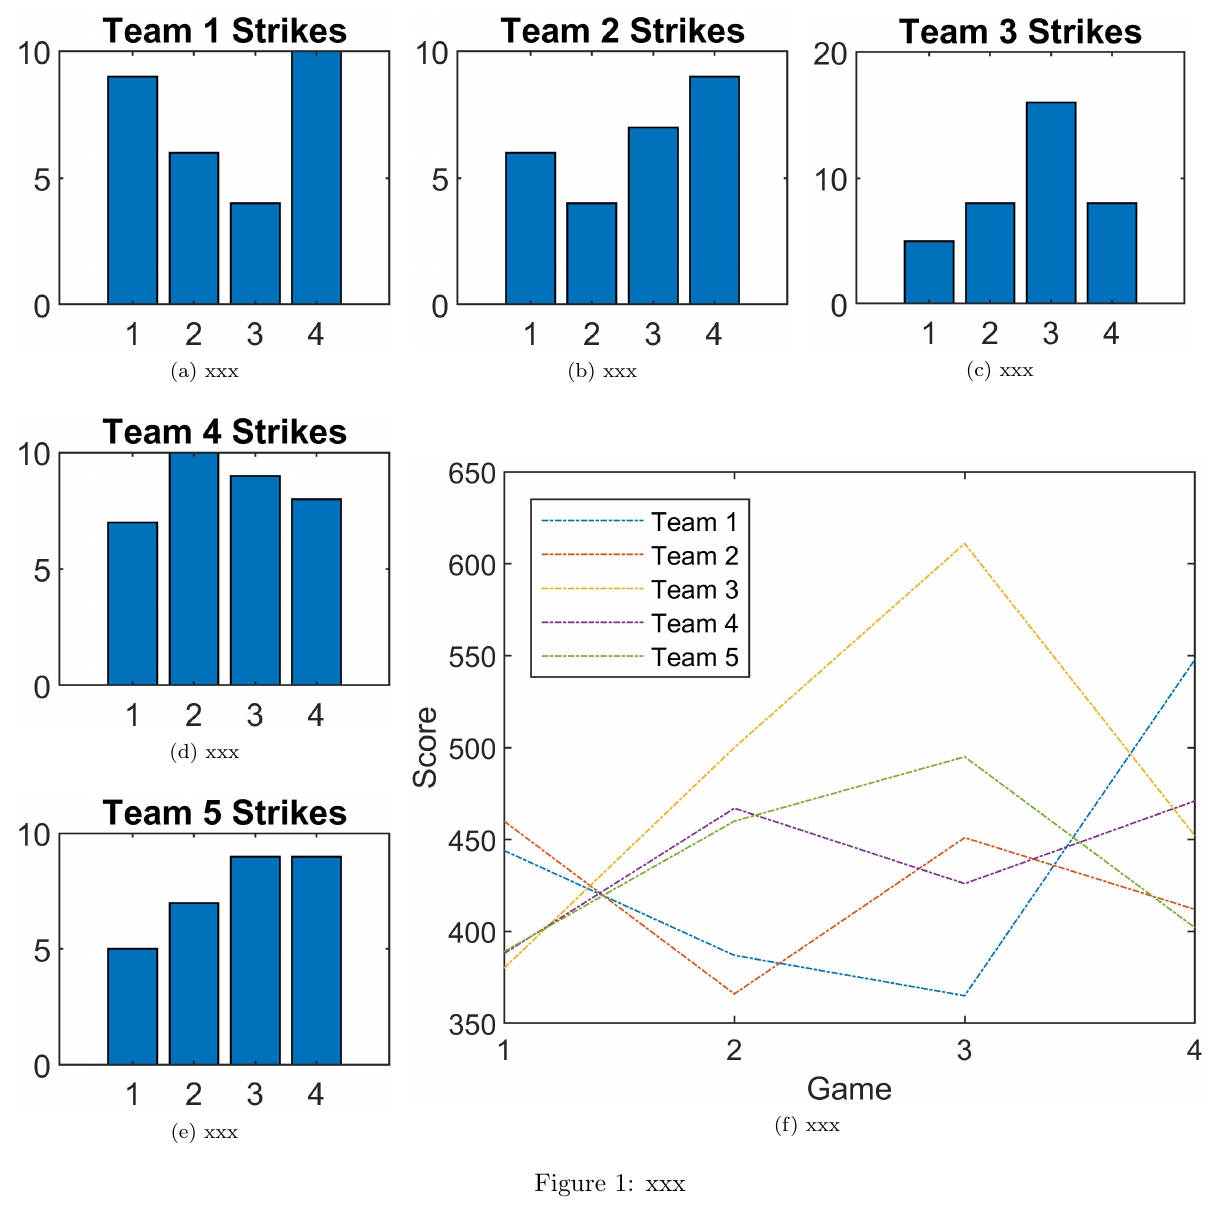
All subfigures are generated by the MATLAB script1:
1
2
3
4
5
6
7
8
9
10
11
12
13
14
15
16
17
18
19
20
21
22
23
24
25
26
27
28
29
30
31
32
33
34
35
36
37
38
39
40
41
42
43
44
45
46
47
48
49
50
51
52
53
54
55
56
57
58
59
60
61
clc, clear, close all

scores = [444 460 380 388 389
          387 366 500 467 460
          365 451 611 426 495
          548 412 452 471 402];

strikes = [9  6  5  7  5
           6  4  8 10  7
           4  7 16  9  9
           10  9  8  8  9];

t = tiledlayout(3,3);

% Team 1
nexttile
bar([1 2 3 4],strikes(:,1))
title('Team 1 Strikes')
ax1 = gca();

% Team 2
nexttile
bar([1 2 3 4],strikes(:,2))
title('Team 2 Strikes')
ax2 = gca();

% Team 3
nexttile
bar([1 2 3 4],strikes(:,3))
title('Team 3 Strikes')
ax3 = gca();

% Team 4
nexttile
bar([1 2 3 4],strikes(:,4))
title('Team 4 Strikes')
ax4 = gca();

% Team 5
nexttile(7)
bar([1 2 3 4],strikes(:,5))
title('Team 5 Strikes')
ax5 = gca();

nexttile(5,[2 2]);
plot([1 2 3 4],scores,'-.')
labels = {'Team 1','Team 2','Team 3','Team 4','Team 5'};
legend(labels,'Location','northwest')

% Configure ticks and axis labels
xticks([1 2 3 4])
xlabel('Game')
ylabel('Score')
ax6 = gca();

exportgraphics(ax1, "fig1.jpg", "Resolution", 600)
exportgraphics(ax2, "fig2.jpg", "Resolution", 600)
exportgraphics(ax3, "fig3.jpg", "Resolution", 600)
exportgraphics(ax4, "fig4.jpg", "Resolution", 600)
exportgraphics(ax5, "fig5.jpg", "Resolution", 600)
exportgraphics(ax6, "fig6.jpg", "Resolution", 600)
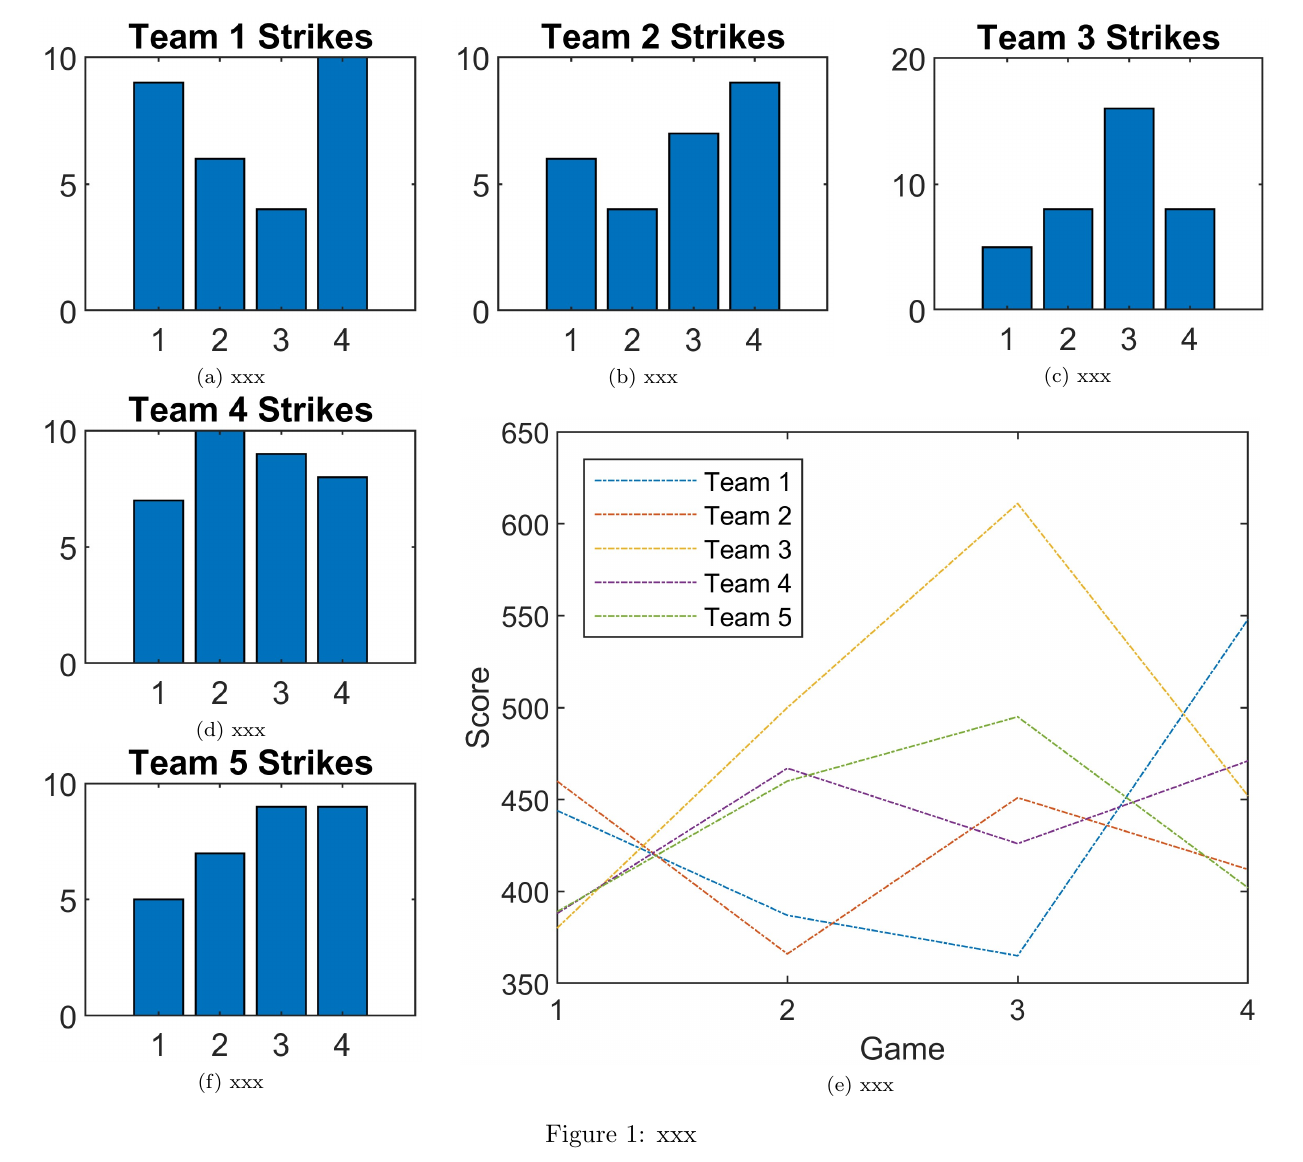
Furthermore, we can put them in one tabular environment and use commands \multicolumn and \multirow to merge some table cells if needed (by the way, don’t forget to import multirow package):
1
2
3
4
5
6
7
8
9
10
11
12
13
14
15
16
17
18
19
20
21
22
23
24
25
26
27
28
29
30
31
32
33
34
35
36
37
38
39
40
41
42
\documentclass{article}
\usepackage[margin=1in]{geometry}
\usepackage{graphicx,subfig,multirow}

\begin{document}

\begin{figure*}[htp]
\centering

\begin{tabular}{lcr}
	% Fig 1
	\begin{minipage}{0.32\linewidth}
		\subfloat[xxx]{\includegraphics[width=\linewidth]{fig1.jpg}}
	\end{minipage} &
	% Fig 2
	\begin{minipage}{0.32\linewidth}
		\subfloat[xxx]{\includegraphics[width=\linewidth]{fig2.jpg}}
	\end{minipage} &
	% Fig 3
	\begin{minipage}{0.32\linewidth}
		\subfloat[xxx]{\includegraphics[width=\linewidth]{fig3.jpg}}
	\end{minipage} \\[2em]
	% Fig 4
	\begin{minipage}{0.32\linewidth}
		\subfloat[xxx]{\includegraphics[width=\linewidth]{fig4.jpg}}
	\end{minipage} &
	% Fig 6
	\multicolumn{2}{c}{
		\multirow{2}{*}[5.3em]{
		\begin{minipage}{0.67\linewidth}
			\subfloat[xxx]{\includegraphics[width=\linewidth]{fig6.jpg}}
		\end{minipage}
	}} \\
	% Fig 5
	\begin{minipage}{0.32\linewidth}
		\subfloat[xxx]{\includegraphics[width=\linewidth]{fig5.jpg}}
	\end{minipage}
\end{tabular}
\caption{xxx}
\end{figure*}

\end{document}
References