A Blue Scree Windows Error Because of Old Network Driver — NETIO!StreamInvokeCalloutAndNormalizeAction+0x5c
Days ago, I bought a new laptop1, but these days I found a Windows blue-screen error occurs from time to time, which leads the laptop re-start instantly. So, I decide to solve this problem today.
At first, a Windows blue-screen situation shows some error message on blue background screen and then restart the computer in a few seconds (actually I feel it’s less than 2 seconds …), so I have no time to take a photo for the error information (like error code). Actually, however, Windows will record them automatically in a .dmp file, which can be found in the path C:\Windows\Minidump2:
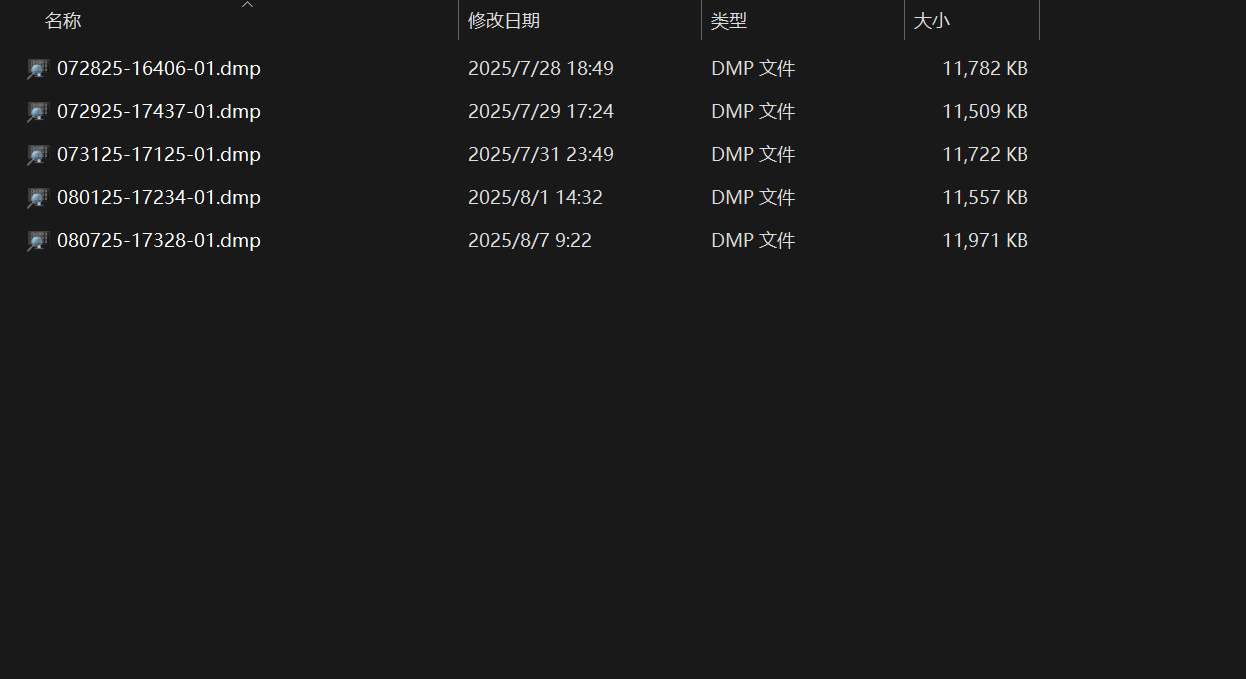
The extension .dmp means the file is a memory dump file, which can help us determine why computer failed3 (and it seems that the system will regularly clean these .dmp files).
Then we should use the debugger WinDbg, which is provided by Microsoft, to analyze crash dumps4. We can find the download link on the webpage4 (By the way, from which I download the install file windbg.appinstaller, but I can’t install the software via it. Finally, I download it successfully from the Microsoft Store5).
After download, run it as an administrator (NOTE HERE). Next, we need to configure a path called Symbol path. Because that the WinDbg that I downloaded is a new version, so we can find Symbol path at File > Settings > Debugging settings > Symbol path:
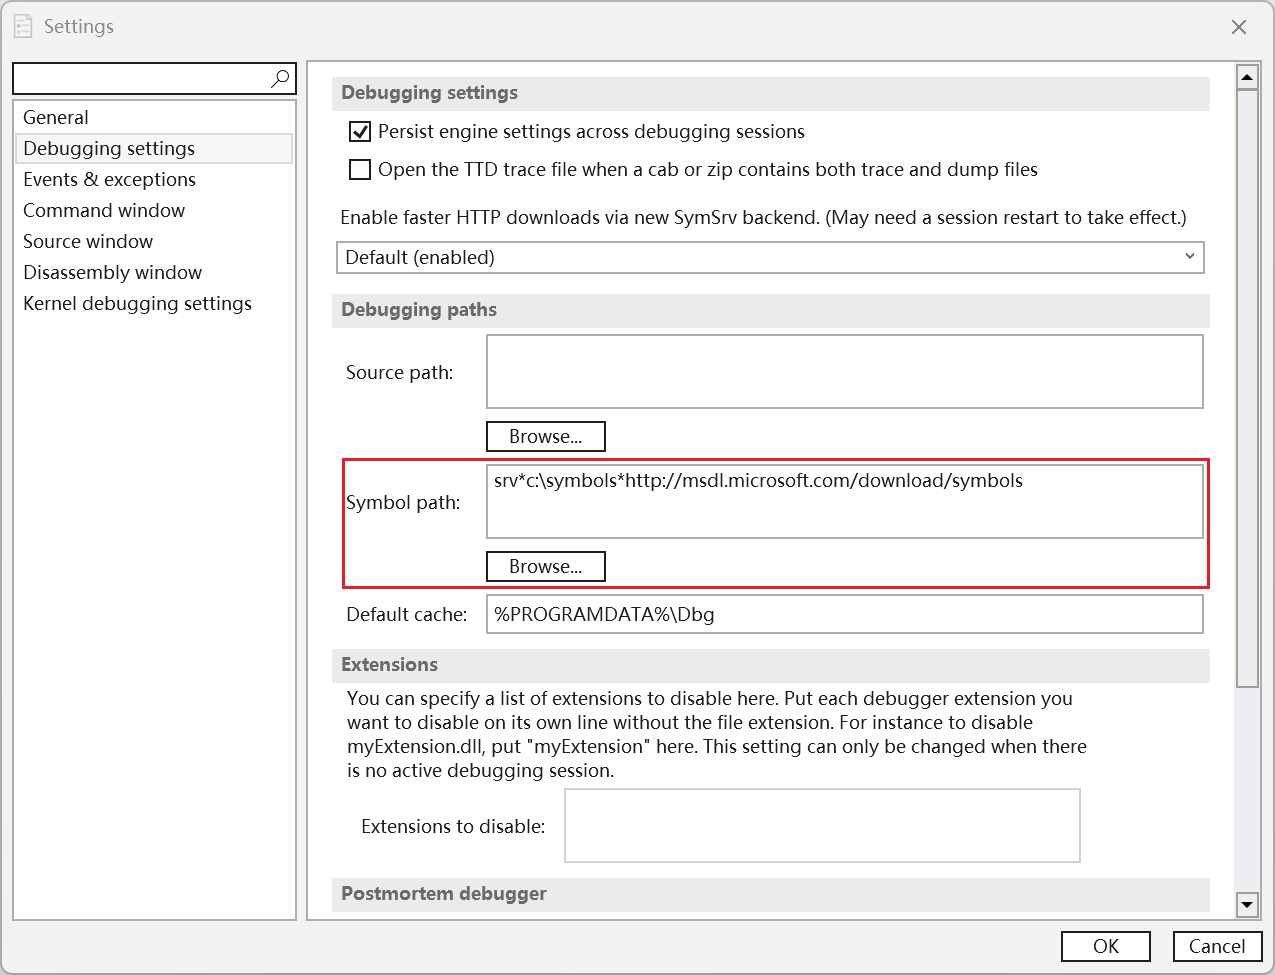
which is sort of different from the way in references26. Anyway, fill in srv*c:\Symbol*https://msdl.microsoft.com/download/symbols in the blank.
Next, open the dump file following steps File > Start debugging > Open dump file — I select 080725-17328-01.dmp. WinDbg will automatically load the file, then it prompts: For analysis of this file, run !analyze -v. So, click run !analyze -v to run the command2. Finally, I get a whole report as follows:
1
2
3
4
5
6
7
8
9
10
11
12
13
14
15
16
17
18
19
20
21
22
23
24
25
26
27
28
29
30
31
32
33
34
35
36
37
38
39
40
41
42
43
44
45
46
47
48
49
50
51
52
53
54
55
56
57
58
59
60
61
62
63
64
65
66
67
68
69
70
71
72
73
74
75
76
77
78
79
80
81
82
83
84
85
86
87
88
89
90
91
92
93
94
95
96
97
98
99
100
101
102
103
104
105
106
107
108
109
110
111
112
113
114
115
116
117
118
119
120
121
122
123
124
125
126
127
128
129
130
131
132
133
134
135
136
137
138
139
140
141
142
143
144
145
146
147
148
149
150
151
152
153
154
155
156
157
158
159
160
161
162
163
164
165
166
167
168
169
170
171
172
173
174
175
176
177
178
179
180
181
182
183
184
185
186
187
188
189
190
191
192
193
194
195
196
197
198
199
200
201
202
203
204
205
206
207
208
209
210
211
212
213
214
215
216
217
218
219
220
221
222
223
224
225
226
227
228
229
230
231
232
233
234
235
236
237
238
239
240
241
242
243
244
245
246
247
248
249
250
251
252
253
254
255
256
257
258
259
260
261
262
263
264
265
266
267
268
269
270
271
272
273
274
275
276
277
278
279
280
281
282
283
284
285
286
287
288
289
290
291
292
293
294
295
296
297
298
299
300
301
302
303
304
305
306
307
308
309
310
311
312
313
314
315
316
317
318
319
320
321
322
323
324
325
326
327
328
329
330
331
332
333
334
335
336
337
338
339
340
341
342
343
344
345
346
347
348
349
350
351
352
353
354
355
356
357
358
359
360
361
362
363
************* Preparing the environment for Debugger Extensions Gallery repositories **************
   ExtensionRepository : Implicit
   UseExperimentalFeatureForNugetShare : true
   AllowNugetExeUpdate : true
   NonInteractiveNuget : true
   AllowNugetMSCredentialProviderInstall : true
   AllowParallelInitializationOfLocalRepositories : true
   EnableRedirectToChakraJsProvider : false

   -- Configuring repositories
      ----> Repository : LocalInstalled, Enabled: true
      ----> Repository : UserExtensions, Enabled: true

>>>>>>>>>>>>> Preparing the environment for Debugger Extensions Gallery repositories completed, duration 0.000 seconds

************* Waiting for Debugger Extensions Gallery to Initialize **************

>>>>>>>>>>>>> Waiting for Debugger Extensions Gallery to Initialize completed, duration 0.063 seconds
   ----> Repository : UserExtensions, Enabled: true, Packages count: 0
   ----> Repository : LocalInstalled, Enabled: true, Packages count: 45

Microsoft (R) Windows Debugger Version 10.0.27871.1001 AMD64
Copyright (c) Microsoft Corporation. All rights reserved.


Loading Dump File [C:\Windows\Minidump\080725-17328-01.dmp]
Mini Kernel Dump File: Only registers and stack trace are available


************* Path validation summary **************
Response                         Time (ms)     Location
Deferred                                       srv*c:\symbols*http://msdl.microsoft.com/download/symbols
Symbol search path is: srv*c:\symbols*http://msdl.microsoft.com/download/symbols
Executable search path is:
Windows 10 Kernel Version 26100 MP (24 procs) Free x64
Product: WinNt, suite: TerminalServer SingleUserTS Personal
Kernel base = 0xfffff802`bb400000 PsLoadedModuleList = 0xfffff802`bc2f4de0
Debug session time: Thu Aug  7 09:22:08.961 2025 (UTC + 8:00)
System Uptime: 5 days 18:17:47.912
Loading Kernel Symbols
..

Press ctrl-c (cdb, kd, ntsd) or ctrl-break (windbg) to abort symbol loads that take too long.
Run !sym noisy before .reload to track down problems loading symbols.

.............................................................
................................................................
................................................................
...........................................................
Loading User Symbols
PEB is paged out (Peb.Ldr = 00000070`76225018).  Type ".hh dbgerr001" for details
Loading unloaded module list
..................................................
For analysis of this file, run !analyze -v
nt!KeBugCheckEx:
fffff802`bb8feba0 48894c2408      mov     qword ptr [rsp+8],rcx ss:0018:ffffcf06`53b5f6e0=000000000000000a
13: kd> !analyze -v
Loading Kernel Symbols
..

Press ctrl-c (cdb, kd, ntsd) or ctrl-break (windbg) to abort symbol loads that take too long.
Run !sym noisy before .reload to track down problems loading symbols.

.............................................................
................................................................
................................................................
...........................................................
Loading User Symbols
PEB is paged out (Peb.Ldr = 00000070`76225018).  Type ".hh dbgerr001" for details
Loading unloaded module list
..................................................
*******************************************************************************
*                                                                             *
*                        Bugcheck Analysis                                    *
*                                                                             *
*******************************************************************************

DRIVER_IRQL_NOT_LESS_OR_EQUAL (d1)
An attempt was made to access a pageable (or completely invalid) address at an
interrupt request level (IRQL) that is too high.  This is usually
caused by drivers using improper addresses.
If kernel debugger is available get stack backtrace.
Arguments:
Arg1: 0000000000000008, memory referenced
Arg2: 0000000000000002, IRQL
Arg3: 0000000000000000, value 0 = read operation, 1 = write operation
Arg4: fffff8024e50c688, address which referenced memory

Debugging Details:
------------------


KEY_VALUES_STRING: 1

    Key  : Analysis.CPU.mSec
    Value: 1140

    Key  : Analysis.Elapsed.mSec
    Value: 11987

    Key  : Analysis.IO.Other.Mb
    Value: 0

    Key  : Analysis.IO.Read.Mb
    Value: 1

    Key  : Analysis.IO.Write.Mb
    Value: 26

    Key  : Analysis.Init.CPU.mSec
    Value: 1000

    Key  : Analysis.Init.Elapsed.mSec
    Value: 327422

    Key  : Analysis.Memory.CommitPeak.Mb
    Value: 112

    Key  : Analysis.Version.DbgEng
    Value: 10.0.27871.1001

    Key  : Analysis.Version.Description
    Value: 10.2505.01.02 amd64fre

    Key  : Analysis.Version.Ext
    Value: 1.2505.1.2

    Key  : Bugcheck.Code.LegacyAPI
    Value: 0xd1

    Key  : Bugcheck.Code.TargetModel
    Value: 0xd1

    Key  : Dump.Attributes.AsUlong
    Value: 0x21808

    Key  : Dump.Attributes.DiagDataWrittenToHeader
    Value: 1

    Key  : Dump.Attributes.ErrorCode
    Value: 0x0

    Key  : Dump.Attributes.KernelGeneratedTriageDump
    Value: 1

    Key  : Dump.Attributes.LastLine
    Value: Dump completed successfully.

    Key  : Dump.Attributes.ProgressPercentage
    Value: 0

    Key  : Failure.Bucket
    Value: AV_NETIO!StreamInvokeCalloutAndNormalizeAction

    Key  : Failure.Exception.IP.Address
    Value: 0xfffff8024e50c688

    Key  : Failure.Exception.IP.Module
    Value: NETIO

    Key  : Failure.Exception.IP.Offset
    Value: 0x1c688

    Key  : Failure.Hash
    Value: {c2ca2d1f-cfdc-88d5-c7bc-7693b8f0de04}

    Key  : Hypervisor.Enlightenments.ValueHex
    Value: 0x7417df84

    Key  : Hypervisor.Flags.AnyHypervisorPresent
    Value: 1

    Key  : Hypervisor.Flags.ApicEnlightened
    Value: 0

    Key  : Hypervisor.Flags.ApicVirtualizationAvailable
    Value: 1

    Key  : Hypervisor.Flags.AsyncMemoryHint
    Value: 0

    Key  : Hypervisor.Flags.CoreSchedulerRequested
    Value: 0

    Key  : Hypervisor.Flags.CpuManager
    Value: 1

    Key  : Hypervisor.Flags.DeprecateAutoEoi
    Value: 1

    Key  : Hypervisor.Flags.DynamicCpuDisabled
    Value: 1

    Key  : Hypervisor.Flags.Epf
    Value: 0

    Key  : Hypervisor.Flags.ExtendedProcessorMasks
    Value: 1

    Key  : Hypervisor.Flags.HardwareMbecAvailable
    Value: 1

    Key  : Hypervisor.Flags.MaxBankNumber
    Value: 0

    Key  : Hypervisor.Flags.MemoryZeroingControl
    Value: 0

    Key  : Hypervisor.Flags.NoExtendedRangeFlush
    Value: 0

    Key  : Hypervisor.Flags.NoNonArchCoreSharing
    Value: 1

    Key  : Hypervisor.Flags.Phase0InitDone
    Value: 1

    Key  : Hypervisor.Flags.PowerSchedulerQos
    Value: 0

    Key  : Hypervisor.Flags.RootScheduler
    Value: 0

    Key  : Hypervisor.Flags.SynicAvailable
    Value: 1

    Key  : Hypervisor.Flags.UseQpcBias
    Value: 0

    Key  : Hypervisor.Flags.Value
    Value: 55185662

    Key  : Hypervisor.Flags.ValueHex
    Value: 0x34a10fe

    Key  : Hypervisor.Flags.VpAssistPage
    Value: 1

    Key  : Hypervisor.Flags.VsmAvailable
    Value: 1

    Key  : Hypervisor.RootFlags.AccessStats
    Value: 1

    Key  : Hypervisor.RootFlags.CrashdumpEnlightened
    Value: 1

    Key  : Hypervisor.RootFlags.CreateVirtualProcessor
    Value: 1

    Key  : Hypervisor.RootFlags.DisableHyperthreading
    Value: 0

    Key  : Hypervisor.RootFlags.HostTimelineSync
    Value: 1

    Key  : Hypervisor.RootFlags.HypervisorDebuggingEnabled
    Value: 0

    Key  : Hypervisor.RootFlags.IsHyperV
    Value: 1

    Key  : Hypervisor.RootFlags.LivedumpEnlightened
    Value: 1

    Key  : Hypervisor.RootFlags.MapDeviceInterrupt
    Value: 1

    Key  : Hypervisor.RootFlags.MceEnlightened
    Value: 1

    Key  : Hypervisor.RootFlags.Nested
    Value: 0

    Key  : Hypervisor.RootFlags.StartLogicalProcessor
    Value: 1

    Key  : Hypervisor.RootFlags.Value
    Value: 1015

    Key  : Hypervisor.RootFlags.ValueHex
    Value: 0x3f7


BUGCHECK_CODE:  d1

BUGCHECK_P1: 8

BUGCHECK_P2: 2

BUGCHECK_P3: 0

BUGCHECK_P4: fffff8024e50c688

FILE_IN_CAB:  080725-17328-01.dmp

TAG_NOT_DEFINED_202b:  *** Unknown TAG in analysis list 202b


DUMP_FILE_ATTRIBUTES: 0x21808
  Kernel Generated Triage Dump

FAULTING_THREAD:  ffffe4067194e080

READ_ADDRESS: fffff802bc3c44c0: Unable to get MiVisibleState
Unable to get NonPagedPoolStart
Unable to get NonPagedPoolEnd
Unable to get PagedPoolStart
Unable to get PagedPoolEnd
unable to get nt!MmSpecialPagesInUse
 0000000000000008

BLACKBOXBSD: 1 (!blackboxbsd)


BLACKBOXNTFS: 1 (!blackboxntfs)


BLACKBOXPNP: 1 (!blackboxpnp)


BLACKBOXWINLOGON: 1

CUSTOMER_CRASH_COUNT:  1

PROCESS_NAME:  ManicTime.exe

STACK_TEXT:
ffffcf06`53b5f6d8 fffff802`bbab83e9     : 00000000`0000000a 00000000`00000008 00000000`00000002 00000000`00000000 : nt!KeBugCheckEx
ffffcf06`53b5f6e0 fffff802`bbab36a8     : ffffcf06`53b5fc01 ffffcf06`53b5fc28 00000000`00000000 ffffcf06`53b5fa30 : nt!KiBugCheckDispatch+0x69
ffffcf06`53b5f820 fffff802`4e50c688     : ffffcf06`53b5fb02 00000000`00000000 fffff802`4e586000 ffffe406`4cdf3800 : nt!KiPageFault+0x468
ffffcf06`53b5f9b0 fffff802`4e50c08b     : ffffe406`b93ea8a0 ffffe406`83a7a901 ffffe406`6d26b8a0 ffffe406`6d26b8a0 : NETIO!StreamInvokeCalloutAndNormalizeAction+0x5c
ffffcf06`53b5fab0 fffff802`4e50ac24     : ffffcf06`53e7d0a0 ffffcf06`53b5fbf0 00000000`00000000 fffff802`4ff6dc01 : NETIO!StreamCalloutProcessingLoop+0x147
ffffcf06`53b5fb70 fffff802`4e509dee     : ffffe406`369e0014 fffff802`4ff61320 ffffcf06`00000001 ffffcf06`53e7d368 : NETIO!StreamProcessCallout+0x2f4
ffffcf06`53b5fca0 fffff802`4e542046     : 00000000`00000014 ffffcf06`53e7d368 ffffcf06`53e7d390 ffffcf06`53e7d0a0 : NETIO!ProcessCallout+0x88e
ffffcf06`53b5fda0 fffff802`4e54449d     : 00000000`0000000c ffffcf06`53e7d318 ffffe406`3c060ba0 ffffe406`62f4f7d0 : NETIO!ArbitrateAndEnforce+0x496
ffffcf06`53b5ff00 fffff802`bbaa512e     : ffffcf06`53b5ffb0 ffffcf06`53e7cd91 ffffe406`7194e080 00000000`00000000 : NETIO!ArbitrateAndEnforceCallout+0x4d
ffffcf06`53b5ff60 fffff802`bbaa50eb     : 00000000`00000000 00000000`00000000 00000000`00000000 00000000`00000000 : nt!KxSwitchKernelStackCallout+0x2e
ffffcf06`53e7ca40 00000000`00000000     : 00000000`00000000 00000000`00000000 00000000`00000000 00000000`00000000 : nt!KiSwitchKernelStackContinue


SYMBOL_NAME:  NETIO!StreamInvokeCalloutAndNormalizeAction+5c

MODULE_NAME: NETIO

IMAGE_NAME:  NETIO.SYS

IMAGE_VERSION:  10.0.26100.4768

STACK_COMMAND: .process /r /p 0xffffe40669ff6080; .thread 0xffffe4067194e080 ; kb

BUCKET_ID_FUNC_OFFSET:  5c

FAILURE_BUCKET_ID:  AV_NETIO!StreamInvokeCalloutAndNormalizeAction

OSPLATFORM_TYPE:  x64

OSNAME:  Windows 10

FAILURE_ID_HASH:  {c2ca2d1f-cfdc-88d5-c7bc-7693b8f0de04}

Followup:     MachineOwner
---------
where note:
1
2
3
4
5
6
7
8
9
10
11
12
13
14
15
16
17
18
19
20
21
SYMBOL_NAME:  NETIO!StreamInvokeCalloutAndNormalizeAction+5c

MODULE_NAME: NETIO

IMAGE_NAME:  NETIO.SYS

IMAGE_VERSION:  10.0.26100.4768

STACK_COMMAND: .process /r /p 0xffffe40669ff6080; .thread 0xffffe4067194e080 ; kb

BUCKET_ID_FUNC_OFFSET:  5c

FAILURE_BUCKET_ID:  AV_NETIO!StreamInvokeCalloutAndNormalizeAction

OSPLATFORM_TYPE:  x64

OSNAME:  Windows 10

FAILURE_ID_HASH:  {c2ca2d1f-cfdc-88d5-c7bc-7693b8f0de04}

Followup:     MachineOwner
From this type of error message, some references point out that this is because that network drivers cause the computer to crash and we can solve it by updating network drivers78910. So, according to steps provided by reference7, I update my network driver MediaTek Wi-Fi 7 MT7925 Wireless LAN Card:
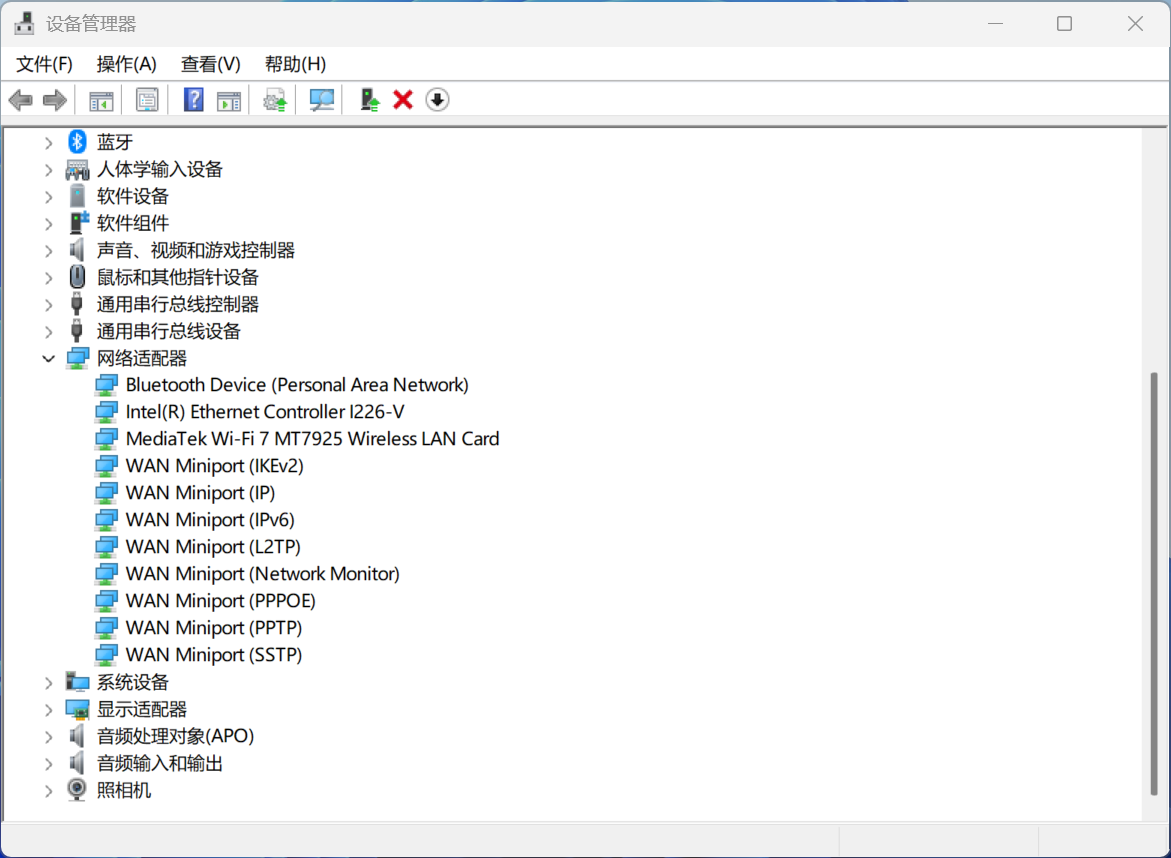
After update, re-start the computer. I hope it works!
Updated Oct. 19, 2025
Recently, the same error occurred multiple times recently. Really annoying, because one time it made my TeXStudio project collapse, and all TeX-related files, including PDF file, were all rewritten as NULL characters, although I saved the .tex file before shut-down for sure. I had to rewrite my homework AGAIN 😡 So today, I deleted the VPN software in my computer to try to address this issue. This is one of methods provided by ChatGPT.
References