Create A Multicolored Line (A Line with Gradual Color) Using MATLAB patch Function
Aug. 04, 2025 • Updated Aug. 05, 2025
In the official documentation of MATLAB path function1, there is a method introduced to create a multicolored line, whose color of each point is determined by the point value (or, the line color is gradual, rather than a single color), with markers by the patch function:
1
2
3
4
5
6
7
8
9
10
11
12
13
14
15
16
clc, clear, close all
% Create a multicolored line with markers at each vertex.
% Interpolate the colors and use a colorbar to show how the values map to the colormap.
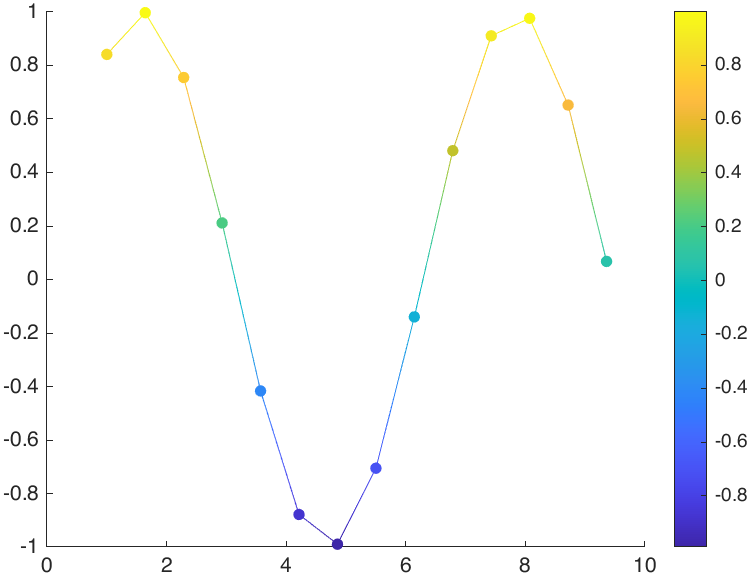
x = linspace(1, 10, 15);
y = sin(x);
y(end) = NaN; % Set the last entry of y to NaN so that patch creates a line instead of a closed polygon.
c = y; % Define a color for each vertex using the y values. The values in c map to colors in the colormap.
patch(x, y, c, ...
"EdgeColor", "interp", ... % Show markers at each vertex and set the EdgeColor to 'interp' to interpolate the colors between vertices
"Marker", "o", ...
"MarkerSize", 5, ...
"MarkerFaceColor","flat");
colorbar
If we increase the number of points, we’ll have:
1
2
3
4
5
% ...

x = linspace(1, 10, 2000);

% ...
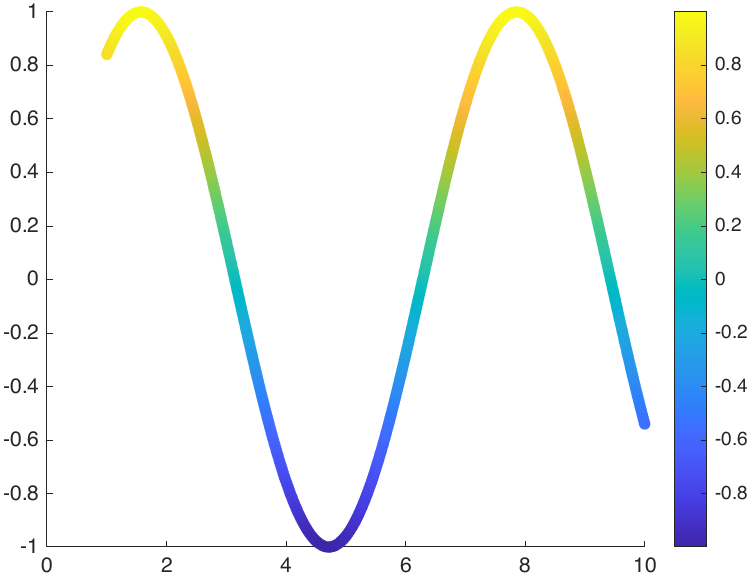
At this time, the plot looks like a smooth “line” (that is without markers) with gradual color.
Actually, it should be noted that, the core of this method is setting "EdgeColor" as "interp", rather than markers — we can just specify the "LineWidth" property to realize a similar effect2:
1
2
3
4
5
6
7
8
9
clc, clear, close all

x = linspace(1,10, 2000);
y = sin(x);
y(end) = NaN;
c = y;

patch(x, y, c, "EdgeColor", "interp", "LineWidth", 5)
colorbar

References