Delete Graph Object in MATLAB Figure
Aug. 03, 2024 • Updated Aug. 03, 2024
1
2
3
4
5
6
7
8
9
10
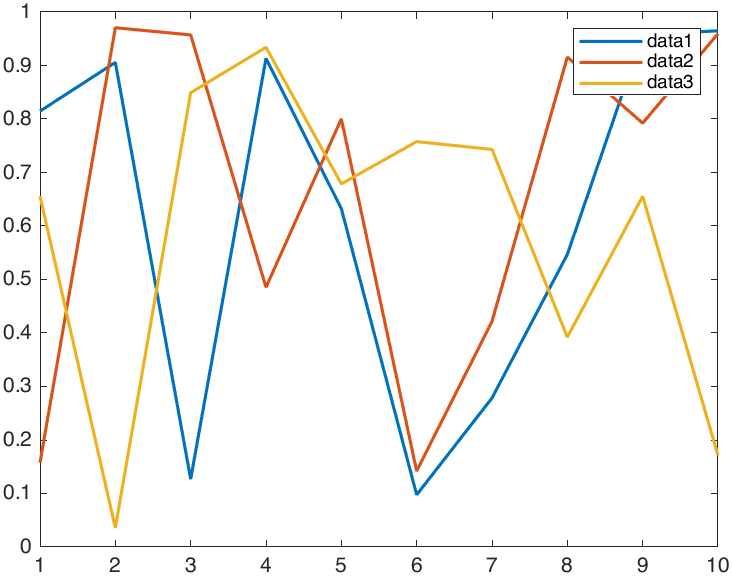
clc, clear, close all
rng("default")
data = rand(10,3);
fig = figure;
ax = axes;
p = plot(data,"LineWidth",1.5);
legend("data1","data2","data3")
1
2
3
4
% ...
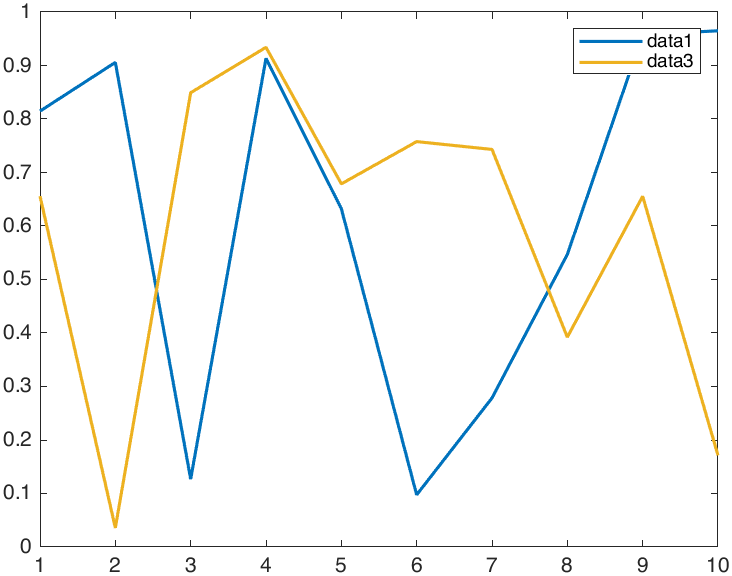
% Delete the second line
delete(p(2))
1
2
3
4
% ...

% Delete the first line of remaining two lines
delete(ax.Children(2))
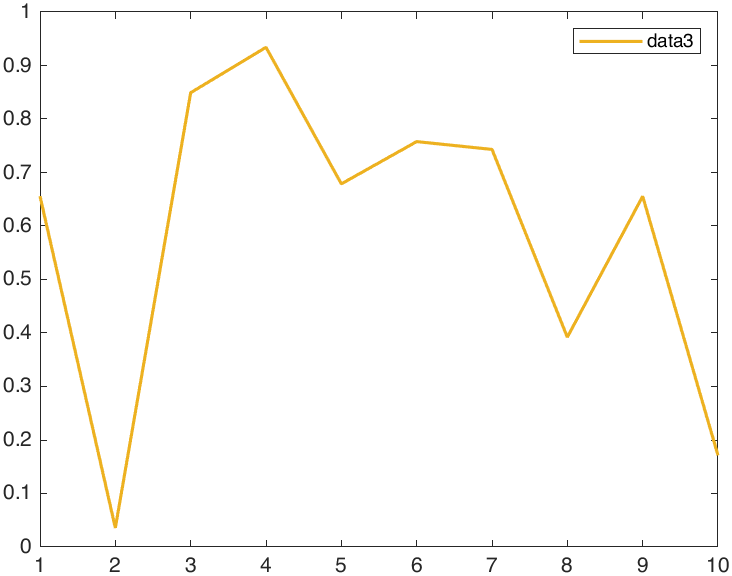
NOTE that, although we can get graph handles by above two methods, they are stored in different orders: the former is sequential, whereas the latter reversed. We can check this point after executing above code snippet.
1
2
3
4
5
6
7
>> p

p =
  3×1 Line array:
  Line    (data1)
  Line    (data2)
  Line    (data3)
1
2
3
4
5
6
7
>> ax.Children

ans =
  3×1 Line array:
  Line    (data3)
  Line    (data2)
  Line    (data1)
References